Feed a virus but starve bacteria? When you’re sick, it may really matter

By Ruslan Medzhitov, Yale University.

Think back to the last time you came down with a cold and what it felt like to be sick. For most people, the feeling of sickness is a set of psychological and behavioral changes including fatigue, lethargy, changes in appetite, changes in sleep patterns and a desire to be away from others.

Of course, none of these changes feel particularly good, but what if they are actually good for us in terms of recovering from the infection?

Interestingly, these infection-induced behavioral changes, collectively known as “sickness behaviors,” occur in most other animals – from your pet dogs and cats to the worms in your backyard. Because so many animals exhibit sickness behaviors during infection, scientists have thought for decades that these behaviors may protect us from infections.

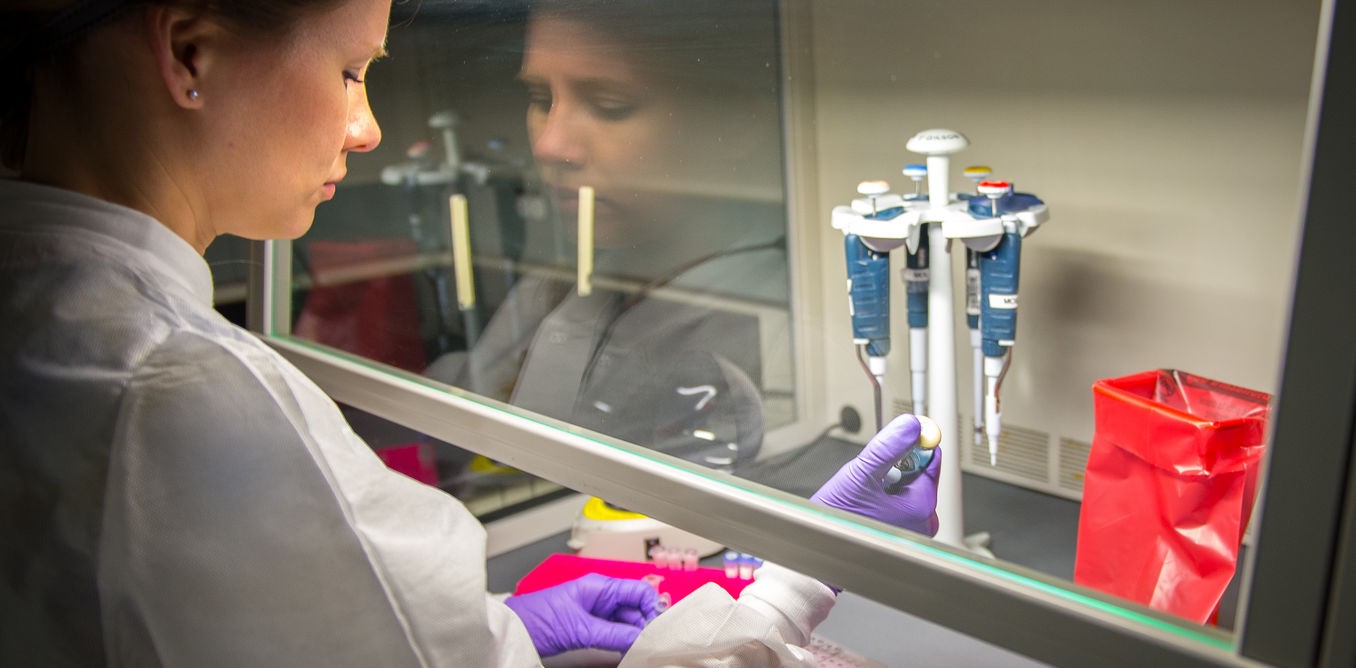
In our immunobiology lab at Yale University, we are interested in these sickness behaviors and most recently have focused on the aspect of appetite loss during infection. If all sickness behaviors indeed help us survive infections, then how does loss of appetite specifically fit in?

One common theory is that although we are starving ourselves, starvation is worse for the bacteria or virus than it is for us. Some scientific evidence supports this theory, but a lot does not.

Recently we ventured to reexamine why we lose our appetites when we get sick.

Why your appetite matters when you get an infection

The question of whether or not we should eat when we get sick is commonly argued, both at home and in the hospital. Every family has its own beliefs about how to address appetite loss during infection.

Some believe it’s best to keep well-fed regardless of desire to eat, some swear by old adages like “feed a fever, starve a cold” and few suggest letting the sick individual’s appetite guide their food consumption. Determining which of these is the right approach – or if it even matters – could help people recover better from mild infections.

Another, perhaps more important, reason to understand appetite changes during infection is to improve survival of critically ill patients in intensive care units across the world. Critically ill patients often cannot feed themselves, so doctors generally feed them during the time of critical illness.

But how much food is the right amount of food? And what type of food is best? And which patients should we feed? Doctors have struggled with these questions for decades and have performed many clinical trials to test different feeding regimens, but no definitive conclusions have been reached.

If we could understand the role of appetite in infection, we could provide more rational care for infected patients at home and in the hospital.

Is losing your appetite a good thing when you’re sick?

Based on our recent findings, it depends.

Like humans, lab mice lose their appetite when infected. When we infected mice with the bacteria Listeria monocytogenes and fed them, they died at a much higher frequency.

In stark contrast, when we infected mice with the flu virus and fed them, they survived better than their unfed counterparts.

Interestingly, these same effects were observed when we substituted live bacteria with only a small component of the bacterial wall or replaced a live virus with a synthetic mimic of a virus component. These components are found in many bacteria and viruses, respectively, suggesting that the opposing effects of feeding that we observed might extend to many bacteria and viruses.

We found the glucose in food was largely responsible for the effects of feeding. These effects were reversed when we blocked the cell’s ability to use glucose with chemicals called 2-deoxy-glucose (2DG) or D-manno-heptulose (DMH).

Why does eating affect bacterial and viral infections differently?

T cells, which fight infection, can also harm other cells. T cells, which fight infection, can also harm other cells.
From www.shutterstock.com

Surviving an infection is a complex process with many factors to consider. During an infection, there are two things that can cause damage to the body. The first is direct damage to the body caused by the microbe. The second is collateral damage caused by the immune response.

The immune system’s early defenses are relatively nonspecific – they can be thought of as grenades rather than sniper rifles. Because of this, the immune system can damage other parts of the body in an effort to clear the infection. To defend against this, tissues in the body have mechanisms to detoxify or resist the toxic agents the immune system uses to attack invaders. The ability of tissues to do this is called tissue tolerance.

In our recent study, we found that tissue tolerance to bacterial and viral infections required different metabolic fuels.

Ketone bodies, which are a fuel made by the liver during extended periods of fasting, help to defend against collateral damage from antibacterial immune responses.

In contrast, glucose, which is abundant when eating, helps to defend against the collateral damage of an antiviral immune response.

What does this mean for humans?

It’s too early to say.

The bottom line is that mice are not people. Many promising treatments in mouse models have failed to translate into people. The concepts we’ve discussed here will need to be confirmed and reconfirmed many times over in humans before they can be applied.

But this study does suggest how we should think about our choice of food during illness. Until now, nutrition selection, especially in the setting of critical illness, was arbitrarily chosen, and mostly selected based on the type of organ failure that the patient had.

Our studies would suggest that what may matter more in selecting nutrition for critically ill patients is what kind of infection they have. As for less serious infections, our work suggests that what you feel like eating when you don’t feel well may be your body’s way of telling you how best to optimize your response to the infection.

So maybe this is what Grandma meant when she told you to “starve a fever, stuff a cold.” Maybe she already knew that different infections required different kinds of nutrition for you to get better quicker. Maybe she knew that if you behaved a certain way, honey tea was best for you, or chicken soup. Maybe Grandma was right? We hope to find out as we work to translate this research to humans.

The ConversationRuslan Medzhitov, Professor of Immunobiology, Yale University

This article was originally published on The Conversation. Read the original article.

Genetic studies reveal diversity of early human populations – and pin down when we left Africa

By George Busby, University of Oxford.

Humans are a success story like no other. We are now living in the “Anthropocene” age, meaning much of what we see around us has been made or influenced by people. Amazingly, all humans alive today – from the inhabitants of Tierra del Fuego on the southern tip of the Americas to the Sherpa in the Himalayas and the mountain tribes of Papua New Guinea – came from one common ancestor.

We know that our lineage arose in Africa and quickly spread to the four corners of the globe. But the details are murky. Was there just one population of early humans in Africa at the time? When exactly did we first leave the continent and was there just one exodus? Some scientists believe that all non-Africans today can trace their ancestry back to a single migrant population, while others argue that there were several different waves of migration out of Africa.

Now, three new studies mapping the genetic profiles of more than 200 populations across the world, published in Nature, have started to answer some of these questions.

Out of Africa

Humans initially spread out of Africa through the Middle East, ranging further north into Europe, east across Asia and south to Australasia. Later, they eventually spread north-east over the top of Beringia into the Americas. We are now almost certain that on their way across the globe, our ancestors interbred with at least two archaic human species, the Neanderthals in Eurasia, and the Denisovans in Asia.

Genetics has been invaluable in understanding this past. While hominin fossils hinted that Africa was the birthplace of humanity, it was genetics that proved this to be so. Patterns of genetic variation – how similar or different people’s DNA sequences are – have not only shown that most of the diversity we see in humans today is present within Africa, but also that there are fewer differences within populations the further you get from Africa.

These observations support the “Out of Africa” model; the idea that a small number of Africans moved out of the continent – taking a much reduced gene-pool with them. This genetic bottleneck, and the subsequent growth of non-African populations, meant that there was less genetic diversity to go round, and so there are fewer differences, on average, between the genomes of non-Africans compared to Africans.

When we scan two genomes to identify where these differences, or mutations, lie, we can estimate how long in the past those genomes split from each other. If two genomes share long stretches with no differences, it’s likely that their common ancestor was in the more recent past than the ancestor of two genomes with shorter shared stretches. By interrogating the distribution of mutations between African and non-African genomes, two of the papers just about agree that the genetic bottleneck caused by the migration out of Africa occurred roughly 60,000 years ago. This is also broadly in line with dating from archaeological investigations.

Their research also manages to settle a long-running debate about the structure of African populations at the beginning of the migration. Was the small group of humans who left Africa representative of the whole continent at that time, or had they split off from more southerly populations earlier?

SGDP model of the relationships among diverse humans (select ancient samples are shown in red) that fits the data.
Credit: Swapan Mallick, Mark Lipson and David Reich.

The Simons Genome Diversity Project compared the genomes of 142 worldwide populations, including 20 from across Africa. They conclusively show that modern African hunter-gatherer populations split off from the group that became non-Africans around 130,000 years ago and from West Africans around 90,000 years ago. This indicates that there was substantial substructure of populations in Africa prior to the wave of migration. A second study, led by Danish geneticist Eske Willersev, with far fewer African samples, used similar methods to show that divergence within Africa also started before the migration, around 125,000 years ago.

More migrations?

Following the move out of the continent, the pioneers must then have journeyed incredibly quickly to Australia. The Danish study, the most comprehensive analysis of Aboriginal Australian and Papuan genomes to date, is the first to really examine the position of Australia at the end of the migration.

They found that the ancestors of populations from “Sahul” – Tasmania, Australia and New Guinea – split from the common ancestor of Europeans and Asians 51,000-72,000 years ago. This is prior to their split from each other around 29,000-55,000 years ago, and almost immediately after the move out of Africa. This implies that the group of people who ended up in the Sahul split away from others almost as soon as the initial group left Africa. Substantial mixing with Denisovans is only seen in Sahulians, which is consistent with this early split.

Crucially, because the ancestors of modern-day Europeans and Asians hadn’t split in two at this point, we think that they must have still been somewhere in western Eurasia at this point. This means that there must have been a second migration from west Eurasia into east Asia later on. The Simons Genome Diversity Project study, by contrast, albeit with a far smaller sample of Sahulian genomes, found no evidence for such an early Sahulian split. It instead shows that the ancestors of East Asians and Sahulians split from western Eurasians before they split from each other, and therefore that Denisovan admixture occurred after the former split from each other.

A graphic representation of the interaction between modern and archaic human lines, showing traces of an early out of Africa (xOoA) expansion within the genome of modern Sahul populations.
Dr Mait Metspalu at the Estonian Biocentre, Tartu, Estonia

Meanwhile, a third paper proposes an earlier, “extra” migration out of Africa, some 120,000 years ago. This migration is only visible in the genomes of a separate set of Sahulians sequenced as part of the Estonian Biocentre Human Genome Diversity Panel. Only around 2% per cent of these genomes can be traced to this earlier migration event, which implies that this wave can’t have many ancestors left in the present day. If true (the two other papers find little support for it), this suggests that there must have been a migration across Asia prior to the big one about 60,000 years ago, and that anatomically modern human populations left Africa earlier than many think.

Whatever the reality of the detail of the Out of Africa event, these studies provide some benchmarks for the timings of some of the key events. Importantly, they are also a huge resource of over 600 new and diverse human genomes that provide the genomics community with the opportunity for further understanding of the paths our ancestors took towards the Anthropocene.

The ConversationGeorge Busby, Research Associate in Statistical Genomics, University of Oxford

This article was originally published on The Conversation. Read the original article.

Now, Check Out:

Here’s Evidence that a Massive Collision Formed the Moon

Scientists have new evidence that our moon formed when a planet-sized object struck the infant Earth some 4.5 billion years ago.

Lab simulations show that a giant impact of the right size would not only send a huge mass of debris hurtling into space to form what would become the moon. It would also leave behind a stratified layer of iron and other elements far below Earth’s surface, just like the layer that seismic imaging shows is actually there.

Johns Hopkins University geoscientist Peter Olson says a giant impact is the most prevalent scientific hypothesis on how the moon came to be, but has been considered unproven because there has been no “smoking gun” evidence.

“We’re saying this stratified layer might be the smoking gun,” says Olson, a research professor in earth and planetary sciences. “Its properties are consistent with it being a vestige of that impact.”

“Our experiments bring additional evidence in favor of the giant impact hypothesis,” says Maylis Landeau, lead author of the paper and a postdoctoral fellow at Johns Hopkins when the simulations were done. “They demonstrate that the giant impact scenario also explains the stratification inferred by seismology at the top of the present-day Earth’s core. This result ties the present-day structure of Earth’s core to its formation.”

1,800 miles below Earth’s crust

The argument compares evidence on the stratified layer—believed to be some 200 miles (322 kilometers) thick and 1,800 miles (2,897 kilometers) below the Earth’s surface—with lab simulations of the turbulence of the impact. The turbulence in particular is believed to account for the stratification—meaning there are materials in layers rather than a homogeneous composition—at the top of the planet’s core.

The stratified layer is believed to contain iron and lighter elements, including oxygen, sulfur, and silicon. The existence of the layer is understood from seismic imaging; it is far too deep to be sampled directly.

Up to now, most simulations of the hypothetical big impact have been done in computer models and have not accounted for impact turbulence, Olson says. Turbulence is difficult to simulate mathematically, he adds.

The researchers simulated the impact using liquids meant to approximate the turbulent mixing of materials that would have occurred when a planetary object struck when Earth was just about fully formed—a “proto-Earth,” as scientists call it.

Olson says the experiments depended on the principle of “dynamic similarity.” In this case, that means scientists can make reliable comparisons of fluid flows without doing an experiment as big and powerful as the original Earth impact, which—of course—is impossible. The study in Olson’s lab was meant to simulate the key ratios of forces acting on each other to produce the turbulence of the impact that could leave behind a layered mixture of material.

The researchers conducted more than 60 trials in which about 3.5 ounces of saline or ethanol solutions representing the planetary projectile that hit the Earth were dropped into a rectangular tank holding about 6 gallons of fluid representing the early Earth. In the tank was a combination of fluids in layers that do not mix: oil floating on the top to represent the Earth’s mantle and water below representing the Earth’s core.

Analysis showed that a mix of materials was left behind in varying amounts and that the distribution of the mixture depended on the size and density of the projectile hitting the Earth. The authors argue for a moon-forming projectile smaller or equal to the size of Mars, a bit more than half the size of Earth.

A summary of the study has been published by the journal Nature Geoscience.

Source: Republished from Futurity.org as a derivative work under the Attribution 4.0 International license. Original article posted to Futurity by .

Featured Image Credit: Brian, via Wikimedia Commons, CC BY-2.0

Now, Check Out:

New Breakthrough Crystal Heals Itself After Being Broken in Half

For the first time in the field of solid-state chemistry scientists at NYU Abu Dhabi have developed a smart crystal that can heal itself after breakage without any chemical or biological intervention. The crystal relies on its own molecular structure and physical contact to heal — similar to cuts on skin.

Self-healing polymers has been researched by chemists extensively for more than a decade and until now has only been observed in softer materials like rubber and plastic.

Credit: NYU Abu Dhabi

Pale yellow crystals the size of a baby’s fingernail — and about 0.5 mm thick — were grown in a lab by Dr. Patrick Commins, postdoctoral associate researcher at NYU Abu Dhabi and lead author of the research paper recently published in leading peer-reviewed scientific journal Angwandte Chemie International Edition. The two-year study was conducted on dipyrazolethiuram disulfide crystals.
Commin said his research was inspired by the relationship between sulphur atoms in soft polymers, which tend to flow toward neighbouring sulphur atoms and bond with them easily resulting in self-repair. He decided to test the same bond in crystals.

“What happens when we break the crystal is that we have all these sulphurs moving around and when we press them together they reform their bonds and they heal,” Commins explained.

Commins said the crystal was broken using a machine built specifically to hold tiny objects and that has the capability to break the object cleanly. The two halves of the broken crystal were mechanically brought into contact with each other at room temperature. 24 hours later the crystal was whole again healed. The only defect was a superficial mark left behind by the crack in the middle. The percentage of healing was 6.7 percent and was calculated by comparing the amount of force required to break the crystal before and after the healing process.

Credit: NYU Abu Dhabi

“This is actually a small breakthrough because it kind of shows a concept that was not considered possible before,” said Dr. Pance Naumov, NYU Abu Dhabi associate professor of chemistry and study co-author. “It is the first time we’ve observed that rigid entities like crystals can self-repair. This was not expected. It’s certainly a shift in our understanding of crystals.”

“Crystals found in nature are made from minerals, like calcium and silicates but this crystal is different,” Commins added. “The crystal has been made specifically to have many close sulfur-sulfur bonds and they grow in rather small sizes.”

Commins believes this research is just the beginning.

“We think other crystals can do it (self-heal) but no one has actually explored it. We’ve only investigated one aspect of this field. We are expanding upon the subject and are trying to find other self-healing crystals,” he said.

Dr. Hideyuki Hara, research scientist at Bruker in Japan, is also a co-author on the paper.

Source: Press Release from NYU Abu Dhabi

Now, Check Out:

NASA-Funded Sounding Rocket Solves One Cosmic Mystery, Reveals Another

In the last century, humans realized that space is filled with types of light we can’t see – from infrared signals released by hot stars and galaxies, to the cosmic microwave background that comes from every corner of the universe. Some of this invisible light that fills space takes the form of X-rays, the source of which has been hotly contended over the past few decades.

It wasn’t until the flight of the DXL sounding rocket, short for Diffuse X-ray emission from the Local galaxy, that scientists had concrete answers about the X-rays’ sources. In a new study, published Sept. 23, 2016, in the Astrophysical Journal, DXL’s data confirms some of our ideas about where these X-rays come from, in turn strengthening our understanding of our solar neighborhood’s early history. But it also reveals a new mystery – an entire group of X-rays that don’t come from any known source.

dxl
NASA-funded researchers sent a sounding rocket through the sun’s dense helium wake, called the helium-focusing cone, to understand the origin of certain X-rays in space. (Conceptual graphic not to scale.) Credits: NASA Goddard’s Conceptual Image Lab/Lisa Poje. Click/Tap for larger image

The two known sources of X-ray emission are the solar wind, the sea of solar material that fills the solar system, and the Local Hot Bubble, a theorized area of hot interstellar material that surrounds our solar system.

“We show that the X-ray contribution from the solar wind charge exchange is about forty percent in the galactic plane, and even less elsewhere,” said Massimiliano Galeazzi, an astrophysicist at the University of Miami and an author on the study. “So the rest of the X-rays must come from the Local Hot Bubble, proving that it exists.”

However, DXL also measured some high-energy X-rays that couldn’t possibly come from the solar wind or the Local Hot Bubble.

“At higher energies, these sources contribute less than a quarter of the X-ray emission,” said Youaraj Uprety, lead author on the study and an astrophysicist at University of Miami at the time the research was conducted. “So there’s an unknown source of X-rays in this energy range.”

In the decades since we first discovered the X-ray emission that permeates space, three main theories have been bandied about to explain its origins. First, and quickly ruled out, was the idea that these X-rays are a kind of background noise, coming from the distant reaches of the universe. Our galaxy has lots of neutral gas that would absorb X-rays coming from distant sources – meaning that these X-rays must originate somewhere near our solar system.

The Diffuse X-ray emission from the Local galaxy, or DXL, sounding rocket launched from White Sands Missile Range in New Mexico on Dec. 13, 2012, to study the source of certain X-rays observed near Earth. Credits: White Sands Missile Range, Visual Information Branch
The Diffuse X-ray emission from the Local galaxy, or DXL, sounding rocket launched from White Sands Missile Range in New Mexico on Dec. 13, 2012, to study the source of certain X-rays observed near Earth.
Credits: White Sands Missile Range, Visual Information Branch

So what could produce this kind of X-ray so close to our solar system? Scientists theorized that there was a huge bubble of hot ionized gas enveloping our solar system, with electrons energetic enough that they could release X-rays like this. They called this structure the Local Hot Bubble.

“We think that around 10 million years ago, a supernova exploded and ionized the gas of the Local Hot Bubble,” said Galeazzi. “But one supernova wouldn’t be enough to create such a large cavity and reach these temperatures – so it was probably two or three supernova over time, one inside the other.”

The Local Hot Bubble was the prevailing theory for many years. Then, in the late 1990s, scientists discovered another source of X-rays – a process called solar wind charge exchange.

Our sun is constantly releasing solar material in all directions, a flow of charged particles called the solar wind. Like the sun, the solar wind is made up of ionized gas, where electrons and ions have separated. This means that the solar wind can carry electric and magnetic fields.

When the charged solar wind interacts with pockets of neutral gas, where the electrons and ions are still tightly bound together, it can pick up electrons from these neutral particles, exciting them. As these electrons settle back into a stable state, they lose energy in the form of X-rays – the same type of X-rays that had been thought to come from the Local Hot Bubble.

The discovery of this solar wind X-ray source posed a problem for the Local Hot Bubble theory, since the only indication that it existed were these X-ray observations. But if the hot bubble did exist, it could tell us a lot about how our corner of the galaxy formed.

“Identifying the X-ray contribution of the Local Hot Bubble is important for understanding the structure surrounding our solar system,” said Uprety, who is now an astrophysicist at Middle Tennessee State University. “It helps us build better models of the interstellar material in our solar neighborhood.”

Distinguishing between X-rays from the solar wind and X-rays from the Local Hot Bubble was a challenge – that’s where DXL comes in. DXL flew on what’s called a sounding rocket, which flies for some 15 minutes. These few minutes of observing time above Earth’s atmosphere are valuable, since Earth’s blocks most of these X-rays, making observations like this impossible from the ground. Such short-duration sounding rockets provide a relatively inexpensive way to gather robust space observations.

DXL is the second spacecraft to measure the X-rays in question, but unlike the previous mission – a satellite called ROSAT – DXL flew at a time when Earth was passing through something called the helium-focusing cone. The helium-focusing cone is a region of space where neutral helium is several times denser than in the rest of the inner solar system.

“The solar system is moving through interstellar space at about 15 miles per second,” said Uprety. “This space is filled with hydrogen and helium. The helium is a little heavier, so it carves around the sun to form a tail.”

Because solar wind charge exchange is dependent on having lots of neutral material to interact with, measuring X-rays in the helium-focusing cone could help scientists definitively determine how much of the X-ray emission comes from the solar wind, and how much – if any – comes from the Local Hot Bubble.

DXL’s data revealed that about forty percent of most observed X-rays come from the solar wind. But in higher energy ranges, some X-rays are still unexplained. DXL’s observations show that less than a quarter of the X-ray emission at higher energy levels comes from the solar wind, and the Local Hot Bubble isn’t a good explanation either.

“The temperature of the Local Hot Bubble is not high enough to produce X-rays in this energy range,” said Uprety. “So we’re left with an open question on the source of these X-rays.”

DXL launched from White Sands Missile Range in New Mexico on Dec. 13, 2012. DXL is supported through NASA’s Sounding Rocket Program at the agency’s Wallops Flight Facility at Wallops Island, Virginia, which is managed by NASA’s Goddard Space Flight Center in Greenbelt, Maryland. NASA’sHeliophysics Division manages the sounding-rocket program for the agency.

Source: News release from NASA.gov, used under public domain rights and in accordance with the NASA Media Guidelines

Now, Check Out:

Scientist at work: Tracking melt water under the Greenland ice sheet

By Joel T. Harper, The University of Montana.

During the past decade, I’ve spent nearly a year of my life living on the Greenland ice sheet to study how melt water impacts the movement of the ice.

What happens to the water that finds its way from the melting ice surface to the bottom of the ice sheet is a crucial question for glaciologists like me. Knowing this will help us ascertain how quickly Greenland’s ice sheet could contribute to global sea-level rise. But because doing this type of research requires studying the bottom side of a vast and thick ice sheet, my colleagues and I have developed relatively unique research techniques.

Our approach is to mimic the alpine style of mountaineering to do our polar research. That involves a small group of self-sufficient climbers who keep their loads light and depend on speed and efficiency to achieve their goals. It’s the opposite of expedition-style mountaineering, which relies on a large support crew and lots of heavy equipment to slowly advance a select few people to the summit.

We bring a small team of scientists who are committed to our fast and light field research style, with each person taking on multiple roles. We use mostly homemade equipment that is designed to produce novel results while being lightweight and efficient – the antithesis of “overdesigned.” The chances of scientific failure from this less conventional approach can be unnerving, but the benefits can be worth the risks. Indeed, we’ve already gained significant insights into the Greenland ice sheet’s underside.

Mysterious place

Our science team from the University of Montana and University of Wyoming sleeps in backpacking tents, the endless summer sunshine making shadows that rotate in circles around us. Ice-sheet camping is challenging. Your tent and sleeping pad insulate the ice as it melts, and soon your tent rises up into the relentless winds on an icy drooping pillar. Occasionally people’s tents slide off their pillars in the middle of the night.

But it’s not the melting on the surface that concerns us so much as what’s happening at the base of the Greenland ice sheet. Arctic warming has increased summer melting of this huge reservoir of ice, causing sea levels to rise. Before the melt water runs to the oceans, much of it finds its way to the bottom of the ice sheet.

The additional water can lubricate the base of the ice sheet in places where the ice can be 1,000 or more meters thick. This causes the ice to slide more quickly across the bedrock on which it sits. The result is that more ice is transported from the high center of the ice sheet, where snow accumulates, to the low elevation margins of the ice sheet, where it either calves into the sea or melts in the warmth of low elevations.

A system of pumps and heaters generates a high pressure jet of hot water that is used to melt a hole to the bottom of Greenland ice sheet.

One school of thought is that a feedback may be kicking in; the more water added, the faster the ice will move, and so ultimately the faster the ice will melt.

An alternative hypothesis is that adding more water to the bed will create large water flow pathways at the contact between the ice and bedrock. These channels are efficient at flushing the water quickly, which could limit the effects of increased melt water at the bed. In other words, by adding more water there is actually less lubrication – not more – because a drainage system develops that quickly moves the water away.

We know flowing water generates heat and melts open the channels in the ice. However, the enormous pressure at the base of the ice acts to squeeze the channels shut. Competing forces battle in a complicated dance.

We can represent these processes with equations, and simulate the opening and closing of the channels on a computer. But the meaningfulness of our results depends on whether we have properly accounted for all of the physical processes actually taking place. To test this, we need to look under the ice sheet.

The bottom of the ice sheet is a mysterious place we glaciologists spend a lot of time hypothesizing about. It’s not a place you can actually go and have a look around. So our team has drilled boreholes to the bed of the Greenland ice sheet to insert sensors and to conduct experiments designed to reveal the water flow and ice sliding conditions. They are essentially pinpricks that allow us to test and refine our models.

Homemade heat drill

Our approach to penetrating many hundreds of meters of cold ice (e.g., -18 degrees Celsius) is to run a light and nimble drilling campaign. We use alpine climbing tactics so that we can move quickly around the ice sheet to drill as many holes as we can in different places, to see if conditions vary from place to place. Our drill can be moved long distances in just a few helicopter loads, and we carry it ourselves for shorter hauls.

We don’t have devoted cooks or mechanics or engineers; we have a small group of faculty and carefully selected students who need to do it all. We rely on people who can fiddle with the electronics of homemade instruments while being unafraid of hard manual labor like moving fuel barrels and hooking up heavy pumps and hoses in the biting cold Greenland wind. Back in the lab, these same people must have outstanding skills to apply math and physics to data analysis and modeling.

The drill is moved long distances by helicopter, and shorter distances by hand-carrying over the ice. Our goal is to keep the drilling equipment as small and light as possible to permit easy transport.
Joel Harper, Author provided

Our homemade drill uses hot water to melt a hole through the ice. We capture surface melt water flowing in streams, heat it to near boiling and then pump it at very high pressure through a hose to a nozzle that sprays a carefully designed jet of water.

Our drilling days are long, extending from morning to well into the night. When the hole is finished, that’s when our work really begins because we only have about two hours before the hole completely freezes shut again. We need to get the drill out of the hole and all experiments completed before that happens. Like astronauts who rehearse their spacewalks, we plan every step and try not to panic when something unexpected happens.

We conduct experiments by artificially adding slugs of water to the bed to measure how the drainage system can accommodate extra water. We send down a camera to take pictures of the bed, a suction tube to sample the sediment and homemade sensors to measure the temperature, pressure and movement of the water. We build the sensors ourselves because you just can’t buy sensors designed for the bottom of a 800-meter-deep hole through an ice sheet.

Joel Harper (Univ. of Montana) and Neil Humphrey (Univ. of Wyoming) operate the hot water drill.
Joel Harper

I’ll admit our fast, light approach to drilling comes with risks. We don’t have redundant systems and we don’t carry lots of backup parts. Our lightweight drill makes a narrow hole, and the top of hole is freezing closed as drilling advances the bottom. We’ve had scary episodes where we’ve almost lost the drill.

A generator fails or a gear box blows, and now the hole is freezing shut around the 700 meters of hose and drill stem. If we can’t come up with a fix within minutes, the drill is lost and the project is over. We could take much less risk by scaling up logistics and reducing our goals. But that would mean doubling the crew and the pile of equipment, and adding another zero to our budget, only to drill one or two holes a year.

Our light-and-nimble approach has allowed us to drill holes quickly and to move large distances. We have drilled 36 boreholes spread along 45 kilometers (28 miles) of the ice sheet’s western side. The holes are up to 850 meters deep, or about a half of a mile, and have produced multi-year records of conditions under the ice.

Different physics than thought

Our instruments have discovered the water pressure under the ice is higher than portrayed by computer models. The melting power of flowing water is less effective than we thought, and so the enormous pressure under the thick ice has the upper hand – the squeezing inhibits large channels from opening.

This does not necessarily mean the ice will move faster due to enhanced lubrication as more melt water reaches the bed. This is because we have also discovered ways the water flows in smaller channels and sheets much more quickly than we expected. Now we are retrofitting our computer models to include these physics.

Our ultimate goal is to improve simulations of Greenland’s future contributions to sea level. Our discoveries are not relevant to tomorrow’s sea level or even next year’s, but nailing down these processes is important for knowing what will happen over upcoming decades to centuries. Sea level rise has big societal consequences, so we will continue our nimble approach to investigating water at Greenland’s bed.

The ConversationJoel T. Harper, Professor of Geosciences, The University of Montana

This article was originally published on The Conversation. Read the original article.

Now, Check Out:

[Video] Physicist’s New Theory Explains Why Time Travel Is Not Possible

A simple question from his wife—Does physics really allow people to travel back in time?—propelled physicist Richard Muller on a quest to resolve a fundamental problem that had puzzled him throughout his career: Why does the arrow of time flow inexorably toward the future, constantly creating new “nows?”

That quest resulted in a new book called NOW: The Physics of Time (W. W. Norton, 2016), which delves into the history of philosophers’ and scientists’ concepts of time, uncovers a tendency physicists have to be vague about time’s passage, demolishes the popular explanation for the arrow of time,“ and proposes a totally new theory.

His idea: Time is expanding because space is expanding.

“The new physics principle is that space and time are linked; when you create new space, you will create new time,” says Muller, a professor emeritus of the University of California, Berkeley.

In commenting on the theory and Muller’s new book, astrophysicist Neil deGrasse Tyson, host of the 2014 TV miniseries Cosmos: A Spacetime Odyssey, writes, “Maybe it’s right. Maybe it’s wrong. But along the way he’s given you a master class in what time is and how and why we perceive it the way we do.”

“Time has been a stumbling block to our understanding of the universe,” adds Muller. “Over my career, I’ve seen a lot of nonsense published about time, and I started thinking about it and realized I had a lot to say from having taught the subject over many decades, having thought about it, having been annoyed by it, having some really interesting ways of presenting it, and some whole new ideas that have never appeared in the literature.”

The origin of ‘now’

Ever since the Big Bang explosively set off the expansion of the universe 13.8 billion years ago, the cosmos has been growing, something physicists can measure as the Hubble expansion. They don’t think of it as stars flying away from one another, however, but as stars embedded in space and space continually expanding.

Muller takes his lead from Albert Einstein, who built his theory of general relativity—the theory that explains everything from black holes to cosmic evolution—on the idea of a four-dimensional spacetime. Space is not the only thing expanding, Muller says; spacetime is expanding. And we are surfing the crest of that wave, what we call “now.”

“Every moment, the universe gets a little bigger, and there is a little more time, and it is this leading edge of time that we refer to as now,” he writes. “The future does not yet exist … it is being created. Now is at the boundary, the shock front, the new time that is coming from nothing, the leading edge of time.”

Because the future doesn’t yet exist, we can’t travel into the future, he asserts. He argues, too, that going back in time is equally improbable, since to reverse time you would have to decrease, at least locally, the amount of space in the universe. That does happen, such as when a star explodes or a black hole evaporates. But these reduce time so infinitesimally that the effect would be hidden in the quantum uncertainty of measurement—an instance of what physicists call cosmic censorship.

“The only example I could come up with is black hole evaporation, and in that case it turns out to be censored. So I couldn’t come up with any way to reverse time, and my basic conclusion is that time travel is not possible,” he says.

Merging black holes

Muller’s theory explaining the flow of time led to a collaboration with Caltech theoretician Shaun Maguire and a paper posted online in June that explains the theory in more detail—using mathematics—and proposes a way to test it using LIGO, an experiment that detects gravitational waves created by merging black holes. of time.”

If Muller and Maguire are right, then when two black holes merge and create new space, they should also create new time, which would delay the gravitational wave signal LIGO observes from Earth.

“The coalescing of two black holes creates millions of cubic miles of new space, which means a one-time creation of new time,” Muller says. The black hole merger first reported by LIGO in February 2016 involved two black holes weighing about 29 and 36 times the mass of the sun, producing a final black hole weighing about 62 solar masses. The new space created in the merger would produce about 1 millisecond of new time, which is near the detection level of LIGO. A similar event at one-third the distance would allow LIGO to detect the newly created time.

‘I expect controversy!’

Whether or not the theory pans out, Muller’s book makes a good case.

“[Muller] forges a new path. I expect controversy!” writes UC Berkeley Nobel laureate Saul Perlmutter, who garnered the 2011 Nobel Prize in Physics for discovering the accelerating expansion of the universe. Muller initiated the project that led to that discovery, which involved measuring the distances and velocities of supernovae. The implication of that discovery is that the progression of time is also accelerating, driven by dark energy.

For the book project, Muller explored previous explanations for the arrow of time and discovered that many philosophers and scientists have been flummoxed by the fact that we are always living in the “now:” from Aristotle and Augustine to Paul Dirac—the discoverer of antimatter, which can be thought of as normal matter moving backward in time—and Albert Einstein. While philosophers were not afraid to express an opinion, most physicists basically ignored the issue.

“No physics theories have the flow of time built into them in any way. Time was just the platform on which you did your calculations—there was no ‘now’ mentioned, no flow of time,” Muller says. “The idea of studying time itself did not exist prior to Einstein. Einstein gave physics the gift of time.”

Einstein, however, was unable to explain the flow of time into the future instead of into the past, despite the fact that the theories of physics work equally well going forward or backward in time. And although he could calculate different rates of time, depending on velocity and gravity, he had no idea why time flowed at all. The dominant idea today for the direction of time came from Arthur Eddington, who helped validate Einstein’s general theory of relativity. Eddington put forward the idea that time flows in the direction of increasing disorder in the universe, or entropy. Because the Second Law of Thermodynamics asserts that entropy can never decrease, time always increases.

Was Stephen Hawking wrong?

This idea has been the go-to explanation since. Even Stephen Hawking, in his book A Brief History of Time, doesn’t address the issue of the flow of time, other than to say that it’s “self-evident” that increasing time comes from increasing entropy.

“I don’t see any way that it affects our everyday lives. But it is fascinating.”

Muller argues, however, that it is not self-evident: it is just wrong. Life and everything we do on Earth, whether building houses or making teacups, involves decreasing the local entropy, even though the total entropy of the universe increases. “We are constantly discarding excess entropy like garbage, throwing it off to infinity in the form of heat radiation,” Muller says. “The entropy of the universe does indeed go up, but the local entropy, the entropy of the Earth and life and civilization, is constantly decreasing.

“During my first big experiment, the measurement of the cosmic microwave radiation, I realized there is 10 million times more entropy in that radiation than there is in all of the mass of the universe, and it’s not changing with time. Yet time is progressing,” he says. “The idea that the arrow of time is set by entropy does not make any predictions, it is simply a statement of a correlation. And to claim it is causation makes no sense.”

In his book, Muller explains the various paradoxes that arise from the way the theories of relativity and quantum mechanics treat time, including the Schrodinger’s cat conundrum and spooky action at a distance that quantum entanglement allows. Neither of these theories addresses the flow of time, however. Theories about wormholes that can transport you across the universe or back in time are speculative and, in many cases, wrong.

The discussion eventually leads Muller to explore deep questions about the ability of the past to predict the future and what that says about the existence of free will.


Muller admits that his new theory about time may have observable effects only in the cosmic realm, such as our interpretation of the red shift—the stretching of light waves caused by the expansion of space—which would have to be modified to reflect the simultaneous expansion of time. The two effects may not be distinguishable throughout most of the universe’s history, but the creation of time might be discernible during the rapid cosmic inflation that took place just after the Big Bang, when space and time expanded much, much faster than today.

He is optimistic that in the next few years LIGO will verify or falsify his theory.

“I think my theory is going to have an impact on calculations of the very early universe,” Muller says. “I don’t see any way that it affects our everyday lives. But it is fascinating.”

Source: Republished from Futurity.org as a derivative work under the Attribution 4.0 International license. Original article posted to Futurity by Robert Sanders-UC Berkeley.

Featured Image Credit:   Kjordand via Wikimedia Commons, CC BY-SA 4.0.

Now, Check Out:

Why teen brains need later school start time

By Kyla Wahlstrom, University of Minnesota.

Millions of high schoolers are having to wake up early as they start another academic year. It is not uncommon to hear comments from parents such as,

“I have a battle every morning to get my teenager out of bed and off to school. It’s a hard way to start every day.”

Sleep deprivation in teenagers as a result of early school start has been a topic of concern and debate for nearly two decades. School principals, superintendents and school boards across the country have struggled with the question of whether their local high school should start later.

So, are teenagers just lazy?

I have been researching the impact of later high school start times for 20 years. Research findings show that teens’ inability to get out of bed before 8 a.m. is a matter of human biology, not a matter of attitude.

At issue here are the sleep patterns of the teenage brain, which are different from those of younger children and adults. Due to the biology of human development, the sleep mechanism in teens does not allow the brain to naturally awaken before about 8 a.m. This often gets into conflict with school schedules in many communities.

History of school timing

In the earliest days of American education, all students attended a single school with a single starting time. In fact, as late as 1910, half of all children attended one-room schools. As schools and districts grew in size in the late 1890s-1920s, staggered starting times became the norm across the country.

In cities and large towns, high school students went first, followed by middle schoolers and then elementary students.

Here’s what research shows

Research findings during the 1980s started to cast a new light on teenagers’ sleep patterns.

Researcher Mary Carskadon and others at Brown University found that the human brain has a marked shift in its sleep/wake pattern during adolescence.

Researchers around the world corroborated those findings. At the onset of puberty, nearly all humans (and most mammals) experience a delay of sleep timing in the brain. As a result, the adolescent body does not begin to feel sleepy until about 10:45 p.m.

At the same time, medical researchers also found that sleep patterns of younger children enabled them to rise early and be ready for learning much earlier than adolescents.

In other words, the biology of the teenage brain is in conflict with early school start times, whereas sleep patterns of most younger children are in sync with schools that start early.

Biology of teenage brain

So, what exactly happens to the teenage brain during the growth years?

In the teens, the secretion of the sleep hormone melatonin begins at about 10:45 p.m. and continues until about 8 a.m. What this means is that teenagers are unable to fall asleep until melatonin secretion begins and they are also not able to awaken until the melatonin secretion stops.

What happens to the brain during teenage years? Brain image via www.shutterstock.com

These changes in the sleep/wake pattern of teens are dramatic and beyond their control. Just expecting teens to go to bed earlier is not a solution.

I have interviewed hundreds of teens who all said that if they went to bed early, they were unable to sleep – they just stared at the ceiling until sleep set in around 10:45 p.m.

According to the National Sleep Foundation, the sleep requirement for teenagers is between 8-10 hours per night. That indicates that the earliest healthy wake-up time for teens should not be before 7 a.m.

A recent research study that I led shows that it takes an average of 54 minutes from the time teens wake up until they leave the house for school. With nearly half of all high schools in the U.S. starting before 8:00 a.m., and over 86 percent starting before 8:30 a.m., leaving home by 7:54 a.m. would be a challenge for most teens in America.

What happens with less sleep

Studies on sleep in general, and on sleep in teens in particular, have revealed the serious negative consequences of lack of adequate sleep. Teens who are sleep-deprived – defined as obtaining less than eight hours per night – are significantly more likely to use cigarettes, drugs and alcohol.

What happens with less sleep?
Student image via www.shutterstock.com

The incidence of depression among teens significantly rises with less than nine hours of sleep. Feelings of sadness and hopelessness increase from 19 percent up to nearly 52 percent in teens who sleep four hours or less per night.

Teen car crashes, the primary cause of death for teenagers, are found to significantly decline when teens obtain more than eight hours of sleep per night.

What changes with later start time?

Results from schools that switched to a late start time are encouraging. Not only does the teens’ use of drugs, cigarettes, and alcohol decline, their academic performance improves significantly with later start time.

The Edina (Minnesota) School District superintendent and school board was the first district in the country to make the change. The decision was a result of a recommendation from the Minnesota Medical Association, back in 1996.

Research showed significant benefits for teens from that school as well as others with later start times.

For example, the crash rate for teens in Jackson Hole, Wyoming in 2013 dropped by 70 percent in the first year after the district adopted a later high school start.

Schools that have made a change have found a difference.
Teenager image via www.shutterstock.com

At this point, hundreds of schools across the country in 44 states have been able to make the shift. The National Sleep Foundation had a count of over 250 high schools having made a change to a later start as early as 2007.

Furthermore, since 2014, major national health organizations have taken a policy stand to support the implementation of later starting time for high school. The American Academy of Pediatrics, the American Medical Association and the Centers for Disease Control and Prevention have all come out with statements that support the starting time of high schools to be 8:30 a.m. or later.

Challenges and benefits

However, there are many schools and districts across the U.S. that are resisting delaying the starting time of their high schools. There are many reasons.

Issues such as changing transportation routes and altering the timing for other grade levels often head the list of factors making the later start difficult. Schools are also concerned about afterschool sports and activities.

Such concerns are valid. However, there could be creative ways of finding solutions. We already know that schools that were able to make the change found solutions that show “out of the box” thinking. For example, schools adopted mixed-age busing, coordinated with public transport systems and expanded afterschool child care.

I do understand that there are other realistic concerns that need to be addressed in making the change. But, in the end, communities that value maximum development for all of its children would also be willing to grapple with solutions.

After all, our children’s ability to move into healthy adult lives tomorrow depends on what we as adults are deciding for them today.

The ConversationKyla Wahlstrom, Senior Research Fellow, University of Minnesota

This article was originally published on The Conversation. Read the original article.

Now, Check Out:

Zika virus: Only a few small outbreaks likely to occur in the continental US

By Natalie Exner Dean, University of Florida; Alessandro Vespignani, Northeastern University; Elizabeth Halloran, University of Washington, and Ira Longini, University of Florida.

It is estimated that about 80 percent of Zika infections are asymptomatic or have symptoms so mild that the disease is not detected. This means the number of cases reported by disease surveillance systems in the U.S. and across the world might be only a small fraction of the actual number of infections. In fact, it’s likely we are are underestimating imported cases in the U.S. and even likely some locally spread cases.

In this situation, mathematical and computational models that account for mosquito populations, human mobility, infrastructure and other factors that influence the spread of Zika are valuable because they can generate estimates of the full extent of the epidemic.

This is what our research group, made up of physicists, biostatisticians and computer scientists, has done for Zika. The Global Epidemic and Mobility Model (GLEAM) can model the spread of Zika through countries and geographical regions.

Our model suggests that while more cases of Zika can be expected in the continental U.S., outbreaks will probably be small and are not projected to spread. By contrast, some countries, like Brazil, have already seen widespread outbreaks.

How does the model work?

Zika is primarily transmitted by Aedes mosquitoes. For a mosquito to transmit Zika to a human, it must first have bitten a human infected with the virus. If enough people infected with Zika travel to a new area with these mosquitoes, the virus could spread in a new geographic region.

That means models for Zika transmission need to take factors like mosquito population, human mobility and temperature, among others, into account.

So we begin by dividing the population of the Americas into geographical cells of similar size, and grouping these cells into subpopulations centered around major transportation hubs.
7
Our model also incorporates data on the density of the mosquitoes that transmit Zika, Aedes aegypti and Aedes albopictus, within those subpopulations. Mosquitoes need warm weather to thrive, so we include a daily estimated temperature for each subpopulation. That allows us to factor seasonal temperature changes into our simulations.

To breed, mosquitoes need standing water, and to spread Zika, they need people to feed on. Areas with standing water, fewer window screens and less air conditioning, which are often lower-income areas, are at greater risk. The model uses detailed data about socioeconomics for each subpopulation, as well as data on the relationship between socioeconomic status and risk of exposure to mosquito-borne disease.

Once all of these factors are incorporated into the model, we simulate a Zika outbreak. These simulations are meant to project what will happen next with Zika, so they need to include information about what has already happened. The simulations were calibrated to match data from countries that experienced the epidemic first, like Brazil and Colombia.

We started by “introducing” Zika into one of 12 major transportation hubs in Brazil. Each calibration starts with a different time and place where Zika was first introduced into the country, and simulates about 500,000 possible epidemics. From those we select a few thousand that match surveillance data to project the epidemic forward. Randomness is also incorporated into the simulations so that the resulting “epidemics” can reflect the natural variability in how diseases spread.

Zika’s spread in the U.S. will be limited

Based on current data, our model projects only small outbreaks from mosquito transmission in the continental U.S. that are likely to die out before spreading to new areas.

Alabama, Arkansas, Georgia, Louisiana, Mississippi, Oklahoma, South Carolina and Texas are at risk of these small outbreaks. This is because it is warm enough in these states through the summer and fall to sustain mosquito transmission.

A map of North America plotting the local Zika transmission potential over time and space. Areas displayed in red have the highest Zika transmission potential.
Zhang et al, CC BY-NC-ND

But the median number of daily cases from local mosquito transmission in these states is projected to be zero. This means that in general we do not expect an outbreak to happen, though small outbreaks are possible. Any outbreaks in these states are expected to end by November or December 2016, consistent with declining temperatures and the end of mosquito season.

Florida, on the other hand, may observe sustained transmission between September and November 2016. After calibrating the model with available surveillance data through mid-August, on average, less than 100 symptomatic Zika cases are projected by the second half of September. As many as eight pregnant women could be locally infected in the first trimester, though these women would not give birth until October 2017. In comparison, over 671 pregnant women infected during travel have already been identified in the U.S. as of September 1, 2016. And, as in other states, when mosquito season ends in December, so will Zika transmission from local mosquitoes.

Keep in mind, we are just talking about people getting infected with Zika from local mosquitoes. In the U.S. the number of local cases is expected to be small relative to the number of travel-related infections and to affect comparatively few pregnant women.

The number of travel-related and local cases that are detected by the Zika surveillance system in the continental U.S. is likely much smaller than the total number of infections. Our model estimates that only 2 percent to 5 percent of travel-related infections are detected by surveillance. And local infections may not be detected for individuals without symptoms. But even taking frequent travel-related infections and low detection rates into account, our models project few local cases in the continental U.S.

It’s a different picture for other parts of the Americas. Our models suggest that larger outbreaks occurred or will occur in Brazil, Colombia, Venezuela and Puerto Rico. All have tropical or subtropical climates, have higher densities of the mosquito vectors, and may be at greater risk due to socioeconomic factors.

This is a projection, not a prediction

Remember, these are projections for what might happen, not predictions of what will happen. No model can perfectly replicate reality.

For instance, this model doesn’t account for sexual transmission. We still don’t know how common it is for a person infected with Zika to transmit it during sex. Sexual transmission may proportionally have a larger effect in domestic outbreaks than we realize.

This type of detailed modeling is complex, and that makes it difficult to examine what is happening within states, or even within single counties. It will take more time and data to analyze simulations at such local levels.

Finally, the model does not include any interventions, such as increased mosquito control. Unless other modes of transmission, such as sexual transmission, turn out to be significant factors, our projection might be considered a worst-case scenario.

Model projections like this should be always scrutinized using information about what is happening on the ground. And they need to be recalibrated and refined as new information becomes available.


Computational simulations and projections for the Zika model are a collaboration overseen by the Center for Inference and Dynamics of Infectious Diseases, a Models of Infectious Disease Agent Study Center of Excellence funded by the National Institutes of Health. The collaboration includes Northeastern University, the University of Florida, the Bruno Kessler Foundation, Bocconi University, the Institute for Scientific Interchange Foundation, the Fred Hutchinson Cancer Research Center, and the University of Washington.

The ConversationNatalie Exner Dean, Postdoctoral Associate in Biostatistics, University of Florida; Alessandro Vespignani, Sternberg Family Distinguished University Professor, Northeastern University; Elizabeth Halloran, Researcher, Fred Hutchinson Cancer Research Center and Professor of Biostatistics, University of Washington, and Ira Longini, Professor & Co-director, Center for Statistics and Quantitative Infectious Diseases, University of Florida

This article was originally published on The Conversation. Read the original article.

Now, Check Out:

Feds: We can read all your email, and you’ll never know

[Editor’s note: this article is themed on legal and ethical issues than science, but we felt our readers would want to know!]

By Clark D. Cunningham, Georgia State University

Fear of hackers reading private emails in cloud-based systems like Microsoft Outlook, Gmail or Yahoo has recently sent regular people and public officials scrambling to delete entire accounts full of messages dating back years. What we don’t expect is our own government to hack our email – but it’s happening. Federal court cases going on right now are revealing that federal officials can read all your email without your knowledge.

As a scholar and lawyer who started researching and writing about the history and meaning of the Fourth Amendment to the Constitution more than 30 years ago, I immediately saw how the FBI versus Apple controversy earlier this year was bringing the founders’ fight for liberty into the 21st century. My study of that legal battle caused me to dig into the federal government’s actual practices for getting email from cloud accounts and cellphones, causing me to worry that our basic liberties are threatened.

A new type of government search

The federal government is getting access to the contents of entire email accounts by using an ancient procedure – the search warrant – with a new, sinister twist: secret court proceedings.

The earliest search warrants had a very limited purpose – authorizing entry to private premises to find and recover stolen goods. During the era of the American Revolution, British authorities abused this power to conduct dragnet searches of colonial homes and to seize people’s private papers looking for evidence of political resistance.

To prevent the new federal government from engaging in that sort of tyranny, special controls over search warrants were written into the Fourth Amendment to the Constitution. But these constitutional provisions are failing to protect our personal documents if they are stored in the cloud or on our smartphones.

Fortunately, the government’s efforts are finally being made public, thanks to legal battles taken up by Apple, Microsoft and other major companies. But the feds are fighting back, using even more subversive legal tactics.

Searching in secret

To get these warrants in the first place, the feds are using the Electronic Communications Privacy Act, passed in 1986 – long before widespread use of cloud-based email and smartphones. That law allows the government to use a warrant to get electronic communications from the company providing the service – rather than the true owner of the email account, the person who uses it.

And the government then usually asks that the warrant be “sealed,” which means it won’t appear in public court records and will be hidden from you. Even worse, the law lets the government get what is called a “gag order,” a court ruling preventing the company from telling you it got a warrant for your email.

You might never know that the government has been reading all of your email – or you might find out when you get charged with a crime based on your messages.

Microsoft steps up

Much was written about Apple’s successful fight earlier this year to prevent the FBI from forcing the company to break the iPhone’s security system.

But relatively little notice has come to a similar Microsoft effort on behalf of customers that began in April 2016. The company’s suit argued that search warrants delivered to Microsoft for customers’ emails are violating regular people’s constitutional rights. (It also argued that being gagged violates Microsoft’s own First Amendment rights.)

Microsoft’s suit, filed in Seattle, says that over the course of 20 months in 2015 and 2016, it received more than 3,000 gag orders – and that more than two-thirds of the gag orders were effectively permanent, because they did not include end dates. Court documents supporting Microsoft describe thousands more gag orders issued against Google, Yahoo, Twitter and other companies. Remarkably, three former chief federal prosecutors, who collectively had authority for the Seattle region for every year from 1989 to 2009, and the retired head of the FBI’s Seattle office have also joined forces to support Microsoft’s position.

The feds get everything

This search warrant clearly spells out who the government thinks controls email accounts – the provider, not the user. U.S. District Court for the Southern District of New York

It’s very difficult to get a copy of one of these search warrants, thanks to orders sealing files and gagging companies. But in another Microsoft lawsuit against the government a redacted warrant was made part of the court record. It shows how the government asks for – and receives – the power to look at all of a person’s email.

On the first page of the warrant, the cloud-based email account is clearly treated as “premises” controlled by Microsoft, not by the email account’s owner:

“An application by a federal law enforcement officer or an attorney for the government requests the search of the following … property located in the Western District of Washington, the premises known and described as the email account [REDACTED]@MSN.COM, which is controlled by Microsoft Corporation.”

The Fourth Amendment requires that a search warrant must “particularly describe the things to be seized” and there must be “probable cause” based on sworn testimony that those particular things are evidence of a crime. But this warrant orders Microsoft to turn over “the contents of all e-mails stored in the account, including copies of e-mails sent from the account.” From the day the account was opened to the date of the warrant, everything must be handed over to the feds.

The warrant orders Microsoft to turn over every email in an account – including every sent message. U.S. District Court for the Southern District of New York

Reading all of it

In warrants like this, the government is deliberately not limiting itself to the constitutionally required “particular description” of the messages it’s looking for. To get away with this, it tells judges that incriminating emails can be hard to find – maybe even hidden with misleading names, dates and file attachments – so their computer forensic experts need access to the whole data base to work their magic.

If the government were serious about obeying the Constitution, when it asks for an entire email account, at least it would write into the warrant limits on its forensic analysis so only emails that are evidence of a crime could be viewed. But this Microsoft warrant says an unspecified “variety of techniques may be employed to search the seized emails,“ including “email by email review.”

The right to read every email. U.S. District Court for the Southern District of New York

As I explain in a forthcoming paper, there is good reason to suspect this type of warrant is the government’s usual approach, not an exception.

Former federal computer-crimes prosecutor Paul Ohm says almost every federal computer search warrant lacks the required particularity. Another former prosecutor, Orin Kerr, who wrote the first edition of the federal manual on searching computers, agrees: “Everything can be seized. Everything can be searched.” Even some federal judges are calling attention to the problem, putting into print their objections to signing such warrants – but unfortunately most judges seem all too willing to go along.

What happens next

If Microsoft wins, then citizens will have the chance to see these search warrants and challenge the ways they violate the Constitution. But the government has come up with a clever – and sinister – argument for throwing the case out of court before it even gets started.

The government has asked the judge in the case to rule that Microsoft has no legal right to raise the Constitutional rights of its customers. Anticipating this move, the American Civil Liberties Union asked to join the lawsuit, saying it uses Outlook and wants notice if Microsoft were served with a warrant for its email.

The government’s response? The ACLU has no right to sue because it can’t prove that there has been or will be a search warrant for its email. Of course the point of the lawsuit is to protect citizens who can’t prove they are subject to a search warrant because of the secrecy of the whole process. The government’s position is that no one in America has the legal right to challenge the way prosecutors are using this law.

Far from the only risk

The government is taking a similar approch to smartphone data.

For example, in the case of U.S. v. Ravelo, pending in Newark, New Jersey, the government used a search warrant to download the entire contents of a lawyer’s personal cellphone – more than 90,000 items including text messages, emails, contact lists and photos. When the phone’s owner complained to a judge, the government argued it could look at everything (except for privileged lawyer-client communications) before the court even issued a ruling.

The federal prosecutor for New Jersey, Paul Fishman, has gone even farther, telling the judge that once the government has cloned the cellphone it gets to keep the copies it has of all 90,000 items even if the judge rules that the cellphone search violated the Constitution.

Where does this all leave us now? The judge in Ravelo is expected to issue a preliminary ruling on the feds’ arguments sometime in October. The government will be filing a final brief on its motion to dismiss the Microsoft case September 23. All Americans should be watching carefully to what happens next in these cases – the government may be already watching you without your knowledge.

The ConversationClark D. Cunningham, W. Lee Burge Chair in Law & Ethics; Director, National Institute for Teaching Ethics & Professionalism, Georgia State University

This article was originally published on The Conversation. Read the original article.

Now, Check Out: