NASA Finds Unusual Origins of High-Energy Electrons

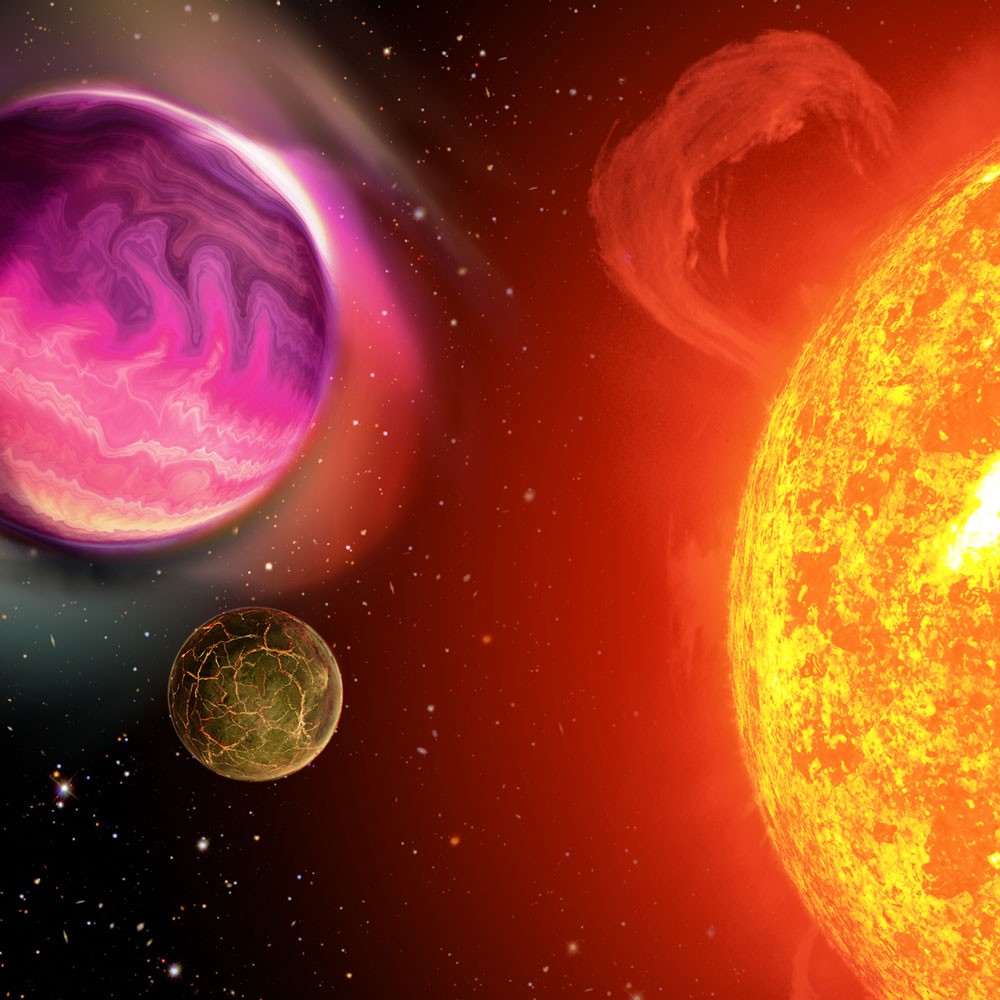
High above the surface, Earth’s magnetic field constantly deflects incoming supersonic particles from the sun. These particles are disturbed in regions just outside of Earth’s magnetic field – and some are reflected into a turbulent region called the foreshock. New observations from NASA’s THEMIS – short for Time History of Events and Macroscale Interactions during Substorms – mission show that this turbulent region can accelerate electrons up to speeds approaching the speed of light. Such extremely fast particles have been observed in near-Earth space and many other places in the universe, but the mechanisms that accelerate them have not yet been concretely understood.

The new results provide the first steps towards an answer, while opening up more questions. The research finds electrons can be accelerated to extremely high speeds in a near-Earth region farther from Earth than previously thought possible – leading to new inquiries about what causes the acceleration. These findings may change the accepted theories on how electrons can be accelerated not only in shocks near Earth, but also throughout the universe. Having a better understanding of how particles are energized will help scientists and engineers better equip spacecraft and astronauts to deal with these particles, which can cause equipment to malfunction and affect space travelers.

“This affects pretty much every field that deals with high-energy particles, from studies of cosmic rays to solar flares and coronal mass ejections, which have the potential to damage satellites and affect astronauts on expeditions to Mars,” said Lynn Wilson, lead author of the paper on these results at NASA’s Goddard Space Flight Center in Greenbelt, Maryland.

The results, published in Physical Review Letters, on Nov. 14, 2016, describe how such particles may get accelerated in specific regions just beyond Earth’s magnetic field. Typically, a particle streaming toward Earth first encounters a boundary region known as the bow shock, which forms a protective barrier between the solar wind, the continuous and varying stream of charged particles flowing from the sun, and Earth. The magnetic field in the bow shock slows the particles, causing most to be deflected away from Earth, though some are reflected back towards the sun. These reflected particles form a region of electrons and ions called the foreshock region.

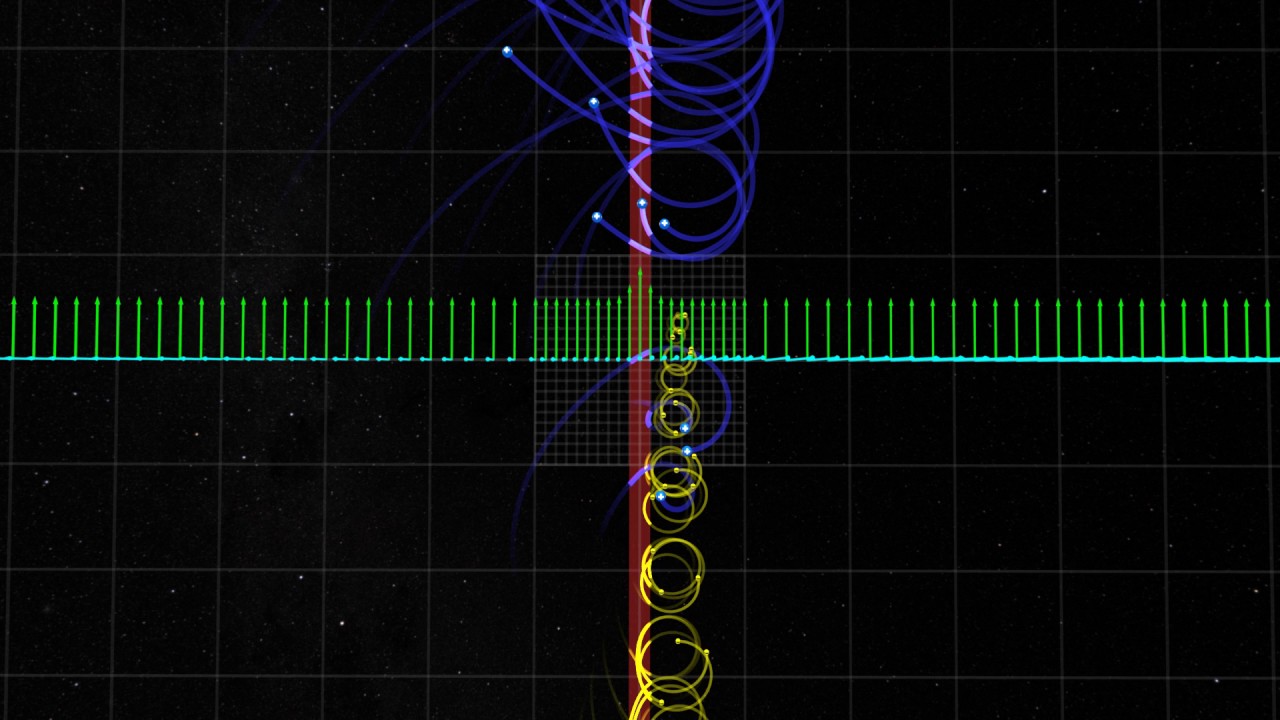
Some of those particles in the foreshock region are highly energetic, fast moving electrons and ions. Historically, scientists have thought one way these particles get to such high energies is by bouncing back and forth across the bow shock, gaining a little extra energy from each collision. However, the new observations suggest the particles can also gain energy through electromagnetic activity in the foreshock region itself.

The observations that led to this discovery were taken from one of the THEMIS – short for Time History of Events and Macroscale Interactions during Substorms – mission satellites. The five THEMIS satellites circled Earth to study how the planet’s magnetosphere captured and released solar wind energy, in order to understand what initiates the geomagnetic substorms that cause aurora. The THEMIS orbits took the spacecraft across the foreshock boundary regions. The primary THEMIS mission concluded successfully in 2010 and now two of the satellites collect data in orbit around the moon.

Operating between the sun and Earth, the spacecraft found electrons accelerated to extremely high energies. The accelerated observations lasted less than a minute, but were much higher than the average energy of particles in the region, and much higher than can be explained by collisions alone. Simultaneous observations from the additional Heliophysics spacecraft, Wind and STEREO, showed no solar radio bursts or interplanetary shocks, so the high-energy electrons did not originate from solar activity.

“This is a puzzling case because we’re seeing energetic electrons where we don’t think they should be, and no model fits them,” said David Sibeck, co-author and THEMIS project scientist at NASA Goddard. “There is a gap in our knowledge, something basic is missing.”

The electrons also could not have originated from the bow shock, as had been previously thought. If the electrons were accelerated in the bow shock, they would have a preferred movement direction and location – in line with the magnetic field and moving away from the bow shock in a small, specific region. However, the observed electrons were moving in all directions, not just along magnetic field lines. Additionally, the bow shock can only produce energies at roughly one tenth of the observed electrons’ energies. Instead, the cause of the electrons’ acceleration was found to be within the foreshock region itself.

“It seems to suggest that incredibly small scale things are doing this because the large scale stuff can’t explain it,” Wilson said.

This visualization represents one of the traditional proposed mechanisms for accelerating particles across a shock, called a shock drift acceleration. The electrons (yellow) and protons (blue) can be seen moving in the collision area where two hot plasma bubbles collide (red vertical line). The cyan arrows represent the magnetic field and the light green arrows, the electric field.
Credits: NASA Goddard’s Scientific Visualization Studio/Tom Bridgman, data visualizer

High-energy particles have been observed in the foreshock region for more than 50 years, but until now, no one had seen the high-energy electrons originate from within the foreshock region. This is partially due to the short timescale on which the electrons are accelerated, as previous observations had averaged over several minutes, which may have hidden any event. THEMIS gathers observations much more quickly, making it uniquely able to see the particles.

Next, the researchers intend to gather more observations from THEMIS to determine the specific mechanism behind the electrons’ acceleration.

Source: NASA.gov news release reused under public domain rights and in accordance with the NASA media guidelines.

Now, Check Out:

Series of NASA CubeSat Missions Will Take a Fresh Look at Planet Earth [Video]

Beginning this month, NASA is launching a suite of six next-generation, Earth-observing small satellite missions to demonstrate innovative new approaches for studying our changing planet.

These small satellites range in size from a loaf of bread to a small washing machine and weigh from a few to 400 pounds. Their small size keeps development and launch costs down as they often hitch a ride to space as a “secondary payload” on another mission’s rocket – providing an economical avenue for testing new technologies and conducting science.

“NASA is increasingly using small satellites to tackle important science problems across our mission portfolio,” said Thomas Zurbuchen, associate administrator of NASA’s Science Mission Directorate in Washington. “They also give us the opportunity to test new technological innovations in space and broaden the involvement of students and researchers to get hands-on experience with space systems.”

Small-satellite technology has led to innovations in how scientists approach Earth observations from space. These new missions, five of which are scheduled to launch during the next several months, will debut new methods to measure hurricanes, Earth’s energy budget, aerosols, and weather.

“NASA is expanding small satellite technologies and using low-cost, small satellites, miniaturized instruments, and robust constellations to advance Earth science and provide societal benefit through applications,” said Michael Freilich, director of NASA’s Earth Science Division in Washington.

Scheduled to launch this month, RAVAN, the Radiometer Assessment using Vertically Aligned Nanotubes, is a CubeSat that will demonstrate new technology for detecting slight changes in Earth’s energy budget at the top of the atmosphere – essential measurements for understanding greenhouse gas effects on climate. RAVAN is led by Bill Swartz at the Johns Hopkins Applied Physics Laboratory in Laurel, Maryland.

In spring 2017, two CubeSats are scheduled to launch to the International Space Station for a detailed look at clouds. Data from the satellites will help improve scientists’ ability to study and understand clouds and their role in climate and weather.

IceCube, developed by Dong Wu at NASA’s Goddard Space Flight Center in Greenbelt, Maryland, will use a new, miniature, high-frequency microwave radiometer to measure cloud ice. HARP, the Hyper-Angular Rainbow Polarimeter, developed by Vanderlei Martins at the University of Maryland Baltimore County in Baltimore, will measure airborne particles and the distribution of cloud droplet sizes with a new method that looks at a target from multiple perspectives.

In early 2017, MiRaTA – the Microwave Radiometer Technology Acceleration mission – is scheduled to launch into space with the National Oceanic and Atmospheric Administration’s Joint Polar Satellite System-1. MiRaTA packs many of the capabilities of a large weather satellite into a spacecraft the size of a shoebox, according to principal investigator Kerri Cahoy from the Massachusetts Institute of Technology in Cambridge. MiRaTA’s miniature sensors will collect data on temperature, water vapor and cloud ice that can be used in weather forecasting and storm tracking.

The RAVAN, HARP, IceCube, and MiRaTA CubeSat missions are funded and managed by NASA’sEarth Science Technology Office (ESTO) in the Earth Science Division. ESTO supports technologists at NASA centers, industry, and academia to develop and refine new methods for observing Earth from space, from information systems to new components and instruments.

“The affordability and rapid build times of these CubeSat projects allow for more risk to be taken, and the more risk we take now the more capable and reliable the instruments will be in the future,” said Pamela Millar, ESTO flight validation lead. “These small satellites are changing the way we think about making instruments and measurements. The cube has inspired us to think more outside the box.”

NASA’s early investment in these new Earth-observing technologies has matured to produce two robust science missions, the first of which is set to launch in December.

CYGNSS – the Cyclone, Global Navigation Satellite System – will be NASA’s first Earth science small satellite constellation. Eight identical satellites will fly in formation to measure wind intensity over the ocean, providing new insights into tropical cyclones. Its novel approach uses reflections from GPS signals off the ocean surface to monitor surface winds and air-sea interactions in rapidly evolving cyclones, hurricanes, and typhoons throughout the tropics. CYGNSS, led by Chris Ruf at the University of Michigan, Ann Arbor, is targeted to launch on Dec. 12 from Cape Canaveral Air Force Station in Florida.

Earlier this year NASA announced the start of a new mission to study the insides of hurricanes with a constellation of 12 CubeSats. TROPICS – the Time-Resolved Observations of Precipitation structure and storm Intensity with a Constellation of Smallsats – will use radiometer instruments based on the MiRaTA CubeSat that will make frequent measurements of temperature and water vapor profiles throughout the life cycle of individual storms. William Blackwell at the Massachusetts Institute of Technology Lincoln Laboratory in Lexington leads the mission.

CYGNSS and TROPICS both benefited from early ESTO technology investments. These Earth Venture missions are small, targeted science investigations that complement NASA’s larger Earth research missions. The rapidly developed, cost-constrained Earth Venture projects are competitively selected and funded by NASA’s Earth System Science Pathfinder program within the Earth Science Division.

Small spacecraft and satellites are helping NASA advance scientific and human exploration, reduce the cost of new space missions, and expand access to space. Through technological innovation, small satellites enable entirely new architectures for a wide range of activities in space with the potential for exponential jumps in transformative science.

Source: NASA.gov news release, republished in accordance with the NASA media guidelines and public domain rights.

Now, Check Out:

How Pluto Spray-Paints Charon Red Like a Graffiti Artist

In June 2015, when the cameras on NASA’s approaching New Horizons spacecraft first spotted the large reddish polar region on Pluto’s largest moon, Charon, mission scientists knew two things: they’d never seen anything like it elsewhere in our solar system, and they couldn’t wait to get the story behind it.

Over the past year, after analyzing the images and other data that New Horizons has sent back from its historic July 2015 flight through the Pluto system, the scientists think they’ve solved the mystery. As they detail this week in the international scientific journal Nature, Charon’s polar coloring comes from Pluto itself – as methane gas that escapes from Pluto’s atmosphere and becomes “trapped” by the moon’s gravity and freezes to the cold, icy surface at Charon’s pole. This is followed by chemical processing by ultraviolet light from the sun that transforms the methane into heavier hydrocarbons and eventually into reddish organic materials called tholins.

full-res-charon
NASA’s New Horizons spacecraft captured this high-resolution, enhanced color view of Pluto’s largest moon, Charon, just before closest approach on July 14, 2015. Scientists have learned that reddish material in the north (top) polar region – informally named Mordor Macula – is chemically processed methane that escaped from Pluto’s atmosphere onto Charon. Credits: NASA/JHUAPL/SwRI. Click/Tap for larger image.

“Who would have thought that Pluto is a graffiti artist, spray-painting its companion with a reddish stain that covers an area the size of New Mexico?” asked Will Grundy, a New Horizons co-investigator from Lowell Observatory in Flagstaff, Arizona, and lead author of the paper. “Every time we explore, we find surprises. Nature is amazingly inventive in using the basic laws of physics and chemistry to create spectacular landscapes.”

The team combined analyses from detailed Charon images obtained by New Horizons with computer models of how ice evolves on Charon’s poles. Mission scientists had previously speculated that methane from Pluto’s atmosphere was trapped in Charon’s north pole and slowly converted into the reddish material, but had no models to support that theory.

The New Horizons team dug into the data to determine whether conditions on the Texas-sized moon (with a diameter of 753 miles or 1,212 kilometers) could allow the capture and processing of methane gas. The models using Pluto and Charon’s 248-year orbit around the sun show some extreme weather at Charon’s poles, where 100 years of continuous sunlight alternate with another century of continuous darkness. Surface temperatures during these long winters dip to -430 Fahrenheit (-257 Celsius), cold enough to freeze methane gas into a solid.

“The methane molecules bounce around on Charon’s surface until they either escape back into space or land on the cold pole, where they freeze solid, forming a thin coating of methane ice that lasts until sunlight comes back in the spring,” Grundy said. But while the methane ice quickly sublimates away, the heavier hydrocarbons created from it remain on the surface.

The models also suggested that in Charon’s springtime the returning sunlight triggers conversion of the frozen methane back into gas. But while the methane ice quickly sublimates away, the heavier hydrocarbons created from this evaporative process remain on the surface.

Sunlight further irradiates those leftovers into reddish material – called tholins – that has slowly accumulated on Charon’s poles over millions of years. New Horizons’ observations of Charon’s other pole, currently in winter darkness – and seen by New Horizons only by light reflecting from Pluto, or “Pluto-shine” – confirmed that the same activity was occurring at both poles.

“This study solves one of the greatest mysteries we found on Charon, Pluto’s giant moon,” said Alan Stern, New Horizons principal investigator from the Southwest Research Institute, and a study co-author. “And it opens up the possibility that other small planets in the Kuiper Belt with moons may create similar, or even more extensive ‘atmospheric transfer’ features on their moons.”

Source: NASA.gov news release used under public domain rights and the NASA Media Guidelines

Now, Check Out:

How the Moon Got its Off-Kilter Orbit

Scientists say there are a couple of problems with the textbook theory of how Earth’s moon formed. One is the moon’s surprisingly Earth-like composition.

Another is that if the moon condensed from a disk of material rotating around Earth’s equator, it should be in orbit over the equator. But the moon’s orbit is tilted 5 degrees off the equator, meaning some more energy must have been put in to move it.

Now researchers are proposing an alternative model.

epicmoon5jul2016
On July 5, 2016, the moon passed between NOAA’s DSCOVR satellite and Earth. NASA’s EPIC camera aboard DSCOVR snapped these images over a period of about four hours. In this set, the far side of the moon, which is never seen from Earth, passes by. In the backdrop, Earth rotates, starting with the Australia and Pacific and gradually revealing Asia and Africa. (Credit: NASA/NOAA)

The textbook theory of lunar formation goes like this: late in the formation of the solar system came the “giant impact” phase, when hot, planet-sized objects collided with each other. A Mars-sized object grazed what would become Earth, throwing off a mass of material from which the moon condensed. This impact set the angular momentum for the Earth-moon system, and gave the early Earth a five-hour day. Over millennia, the moon has receded from the Earth and the rotation has slowed to our current 24-hour day.

Scientists have figured this out by looking at the moon’s current orbit, working out how rapidly angular momentum of the Earth-moon system has been transferred by the tidal forces between the two bodies, and working backward.

‘One giant impact’

In 2012, Sarah Stewart, professor of earth and planetary sciences at the University of California, Davis, and her former postdoctoral fellow Matija Ćuk (now a scientist at the SETI Institute in Mountain View, California) proposed that some of the angular momentum of the Earth-moon system could have been transferred to the Earth-sun system. That allows for a more energetic collision at the beginning of the process.

In the new model, a high-energy collision left a mass of vaporized and molten material from which the Earth and moon formed. The Earth was set spinning with a two-hour day, its axis pointing toward the sun.

Because the collision could have been more energetic than in the current theory, the material from Earth and the impactor would have mixed together, and both Earth and moon condensed from the same material and therefore have a similar composition.

As angular momentum was dissipated through tidal forces, the moon receded from the Earth until it reached a point called the “LaPlace plane transition,” where the forces from the Earth on the moon became less important than gravitational forces from the sun. This caused some of the angular momentum of the Earth-moon system to transfer to the Earth-sun system.

This made no major difference to the Earth’s orbit around the sun, but it did flip Earth upright. At this point, the models built by the team show the moon orbiting Earth at a high angle, or inclination, to the equator.

Over a few tens of million years, the moon continued to slowly move away from Earth until it reached a second transition point, the Cassini transition, at which point the inclination of the moon—the angle between the moon’s orbit and Earth’s equator—dropped to about 5 degrees, putting the moon more or less in its current orbit.

The new theory elegantly explains the moon’s orbit and composition based on a single, giant impact at the beginning, says Stewart, senior author of the paper published in the journal Nature. No extra intervening steps are required to nudge things along. “One giant impact sets off the sequence of events.”

NASA supported the research, which included researchers from the University of Maryland and Harvard University.

Sources: Republished from Futurity.org as a derivative work under the Attribution 4.0 International license. Original article posted to Futurity by . Images from NASA, used under public domain rights.

Now, Check Out:

Relax, the expansion of the universe is still accelerating

By Tamara Davis, The University of Queensland.

There’s been a whirlwind of commentary of late speculating that the acceleration of the expanding universe might not be real after all.

It follows the publication this month of a new look at supernovae in our universe, which the researchers say give only a “marginal detection” of the acceleration of the universe.

This seems to be a big deal, because the 2011 Nobel Prize was awarded to the leaders of two teams that used supernovae to discover that the expansion of the universe is speeding up.

But never have I seen such a storm in a teacup. The new analysis, published in Scientific Reports, barely changes the original result, but puts a different (and in my opinion misleading) spin on it.

So why does this new paper claim that the detection of acceleration is “marginal”?

Well, it is marginal if you only use a single data set. After all, most big discoveries are initially marginal. If they were more obvious, they would have been discovered sooner.

The evidence, so far

The supernova data alone could, at only a slight stretch, be consistent with a universe that neither accelerates nor decelerates. This has been known since the original discovery, and is not under dispute.

But if you also add one more piece of information – for example, that matter exists – then there’s nothing marginal about it. New physics is clearly required.

In fact, if the universe didn’t accelerate or decelerate at all, which is an old proposal revisited in this new paper, new physics would still be required.

These days the important point is that if you take all of the supernova data and throw it in the bin, we still have ample evidence that the universe’s expansion accelerates.

For example, in Australia we did a project called WiggleZ, which over five years made a survey of the positions of almost a quarter of a million galaxies.

The pattern of galaxies isn’t actually random, so we used this pattern to effectively lay grid paper over the universe and measure how its size changes with time.

Using this data alone shows the expanding universe is accelerating, and it is independent of any supernova information. The Nobel Prize was awarded only after this and many other observational techniques confirmed the supernova findings.

Something missing in the universe

Another example is the Cosmic Microwave Background (CMB), which is the leftover afterglow from the big bang and is one of the most precise observational measurements of the universe ever made. It shows that space is very close to flat.

Meanwhile observations of galaxies show that there simply isn’t enough matter or dark matter in the universe to make space flat. About 70% of the universe is missing.

So when observations of supernovae found that 70% of the universe is made up of dark energy, that solved the discrepancy. The supernovae were actually measured before the CMB, so essentially predicted that the CMB would measure a flat universe, a prediction that was confirmed beautifully.

So the evidence for some interesting new physics is now overwhelming.

I could go on, but everything we know so far supports the model in which the universe accelerates. For more detail see this review I wrote about the evidence for dark energy.

What is this ‘dark energy’?

One of the criticisms the new paper levels at standard cosmology is that the conclusion that the universe is accelerating is model dependent. That’s fair enough.

Usually cosmologists are careful to say that we are studying “dark energy”, which is the name we give to whatever is causing the apparent acceleration of the expansion of the universe. (Often we drop the “apparent” in that sentence, but it is there by implication.)

“Dark energy” is a blanket term we use to cover many possibilities, including that vacuum energy causes acceleration, or that we need a new theory of gravity, or even that we’ve misinterpreted general relativity and need a more sophisticated model.

The key feature that is not in dispute is that there is some significant new physics apparent in this data. There is something that goes beyond what we know about how the universe works – something that needs to be explained.

So let’s look at what the new paper actually did. To do so, let’s use an analogy.

Margins of measurement

Imagine you’re driving a car down a 60km/h limit road. You measure your speed to be 55km/h, but your odometer has some uncertainty in it. You take this into account, and are 99% sure that you are travelling between 51km/h and 59km/h.

Now your friend comes along and analyses your data slightly differently. She measures your speed to be 57km/h. Yes, it is slightly different from your measurement, but still consistent because your odometer is not that accurate.

But now your friend says: “Ha! You were only marginally below the speed limit. There’s every possibility that you were speeding!”

In other words, the answer didn’t change significantly, but the interpretation given in the paper takes the extreme of the allowed region and says “maybe the extreme is true”.

For those who like detail, the three standard deviation limit of the supernova data is big enough (just) to include a non-accelerating universe. But that is only if there is essentially no matter in the universe and you ignore all other measurements (see figure, below).

This is a reproduction of Figure 2 from the new research paper with annotations added. The contours encircle the values of the matter density and dark energy (in the form of a cosmological constant) that best fit the supernova data (in units of the critical density of the universe). The contours show one, two, and three standard deviations. The best fit is marked by a cross. The amount of matter measured by other observations lies approximately around the orange line. The contours lie almost entirely in the accelerating region, and the tiny patch that is not yet accelerating will nevertheless accelerate in the future.
Image modified by Samuel Hinton, Author provided

Improving the analysis

This new paper is trying to do something laudable. It is trying to improve the statistical analysis of the data (for comments on their analysis see).

As we get more and more data and the uncertainty on our measurement shrinks, it becomes more and more important to take into account every last detail.

In fact, with the Dark Energy Survey we have three people working full-time on testing and improving the statistical analysis we use to compare supernova data to theory.

We recognise the importance of improved statistical analysis because we’re soon going to have about 3,000 supernovae with which to measure the acceleration far more precisely than the original discoveries, which only had 52 supernovae between them. The sample that this new paper re-analyses contains 740 supernovae.

One final note about the conclusions in the paper. The authors suggest that a non-accelerating universe is worth considering. That’s fine. But you and I, the Earth, the Milky Way and all the other galaxies should gravitationally attract each other.

So a universe that just expands at a constant rate is actually just as strange as one that accelerates. You still have to explain why the expansion doesn’t slow down due to the gravity of everything it contains.

So even if the non-acceleration claim made in this paper is true, the explanation still requires new physics, and the search for the “dark energy” that explains it is just as important.

Healthy scepticism is vital in research. There is still much debate over what is causing the acceleration, and whether it is just an apparent acceleration that arises because our understanding of gravity is not yet complete.

Indeed that is what we as professional cosmologists spend our entire careers investigating. What this new paper and all the earlier papers agree on is that there is something that needs to be explained.

The supernova data show something genuinely weird is going on. The solution might be acceleration, or a new theory of gravity. Whatever it is, we will continue to search for it.

The ConversationTamara Davis, Professor, The University of Queensland

This article was originally published on The Conversation. Read the original article.

Now, Check Out:

Astronomers Investigate Color Changes in Saturn’s Atmospheric Hexagon

Scientists are investigating potential causes for the change in color of the region inside the north-polar hexagon on Saturn. The color change is thought to be an effect of Saturn’s seasons. In particular, the change from a bluish color to a more golden hue may be due to the increased production of photochemical hazes in the atmosphere as the north pole approaches summer solstice in May 2017.

These two natural color images from NASA's Cassini spacecraft show the changing appearance of Saturn's north polar region between 2012 and 2016. Credit: NASA/JPL-Caltech/Space Science Institute/Hampton University. Click/Tap for larger image.
These two natural color images from NASA’s Cassini spacecraft show the changing appearance of Saturn’s north polar region between 2012 and 2016. Credit: NASA/JPL-Caltech/Space Science Institute/Hampton University. Click/Tap for larger image.

Researchers think the hexagon, which is a six-sided jetstream, might act as a barrier that prevents haze particles produced outside it from entering. During the polar winter night between November 1995 and August 2009, Saturn’s north polar atmosphere became clear of aerosols produced by photochemical reactions — reactions involving sunlight and the atmosphere. Since the planet experienced equinox in August 2009, the polar atmosphere has been basking in continuous sunshine, and aerosols are being produced inside of the hexagon, around the north pole, making the polar atmosphere appear hazy today.

Other effects, including changes in atmospheric circulation, could also be playing a role. Scientists think seasonally shifting patterns of solar heating probably influence the winds in the polar regions.

Both images were taken by the Cassini wide-angle camera.

Source: News release on NASA.gov used under public domain rights and in compliance with the NASA Media Guidelines.

Now, Check Out:

Exoplanet Orbiting Nearest Star Could Be Habitable

A rocky extrasolar planet with a mass similar to Earth’s was recently detected around Proxima Centauri, the nearest star to our sun. This planet, called Proxima b, is in an orbit that would allow it to have liquid water on its surface, thus raising the question of its habitability. In a study to be published in The Astrophysical Journal Letters, an international team led by researchers at the Marseille Astrophysics Laboratory (CNRS/Aix-Marseille Université) has determined the planet’s dimensions and properties of its surface, which actually favor its habitability.

This artist’s impression shows a view of the surface of the planet Proxima b orbiting the red dwarf star Proxima Centauri, the closest star to the Solar System. The double star Alpha Centauri AB also appears in the image to the upper-right of Proxima itself. Proxima b is a little more massive than the Earth and orbits in the habitable zone around Proxima Centauri, where the temperature is suitable for liquid water to exist on its surface. Click/Tap for larger image.

The team says Proxima b could be an “ocean planet,” with an ocean covering its entire surface, the water perhaps similar to that of subsurface oceans detected inside icy moons around Jupiter and Saturn. The researchers also show that Proxima b’s composition might resemble Mercury’s, with a metal core making up two-thirds of the mass of the planet. These results provide the basis for future studies to determine the habitability of Proxima b.

Proxima Centauri, the star nearest the sun, has a planetary system consisting of at least one planet. The new study analyzes and supplements earlier observations. These new measurements show that this planet, named Proxima Centauri b or simply Proxima b, has a mass close to that of Earth (1.3 times Earth’s mass) and orbits its star at a distance of 0.05 astronomical units (one tenth of the sun-Mercury distance). Contrary to what one might think, such a small distance does not imply a high temperature on the surface of Proxima b because the host star, Proxima Centauri, is a red dwarf with a mass and radius that are only one-tenth that of the Sun, and a brightness a thousand times smaller than the sun’s. Hence Proxima b is in the habitable zone of its star and may harbor liquid water at its surface.

However, very little is known about Proxima b, particularly its radius. It is therefore impossible to know what the planet looks like, or what it is made of. The radius measurement of an exoplanet is normally done during transit, when it eclipses its star. But Proxima b is not known to transit.

There is another way to estimate the radius of a planet. If we know its mass, we can simulate the behavior of the constituent materials. This is the method used by a French-American team of researchers from the Marseille Astrophysics Laboratory (CNRS/Aix-Marseille University) and the Department of Astronomy at Cornell University. With the help of a model of internal structure, they explored the different compositions that could be associated with Proxima b and deduced the corresponding values for the radius of the planet. They restricted their study to the case of potentially habitable planets, simulating dense and solid planets, formed with the metallic core and rocky mantle found in terrestrial planets in our solar system. They also allowed the incorporation of a large mass of water in their composition.

These assumptions allow a wide variety of compositions for Proxima b. The radius of the planet may vary between 0.94 and 1.40 times the radius of the Earth (3,959 miles, or 6,371 kilometers). The study shows that Proxima b has a minimum radius of 3,722 miles (5,990 kilometers), and the only way to get this value is to have a very dense planet, consisting of a metal core with a mass equal to 65 percent of the planet, the rest being rocky mantle (formed of silicate). The boundary between these two materials is then located about 932 miles (1,500 kilometers) depth. With such a composition, Proxima b is very close to the planet Mercury, which also has a very solid metal core. This first case does not exclude the presence of water on the surface of the planet, as on Earth where the water body does not exceed 0.05 percent of the mass of the planet. In contrast, Proxima b can also have a radius of 5,543 miles (8,920 kilometers), provided that it is composed of 50 percent rock surrounded by 50 percent water. In this case, Proxima b would be covered by a single liquid ocean 124 miles (200 kilometers) deep. Below, the pressure would be so strong that liquid water would turn to high-pressure ice before reaching the boundary with the mantle to 1,926 miles (3,100 kilometers) depth. In these extreme cases, a thin gas atmosphere could cover the planet, as on Earth, making Proxima b potentially habitable.

Such findings provide important additional information to different composition scenarios that have been proposed for Proxima b. Some involve a completely dry planet, while others permit the presence of a significant amount of water in its composition. The work of the research team included providing an estimate of the radius of the planet for each of these scenarios. Similarly, this would restrict the amount of water available on Proxima b, where water is prone to evaporation by ultraviolet and X-rays from the host star, which are much more violent than those from the sun.

Future observations of Proxima Centauri will refine this study. In particular, the measurement of stellar abundances of heavy elements (magnesium, iron, silicon) will decrease the number of possible compositions for Proxima b, allowing determination more accurate radius Proxima b.

Source: News release on NASA.gov used under public domain rights and in compliance with the NASA Media Guidelines

Now, Check Out:

Astounding Discovery May Invalidate Solar System Formation Theories

The discovery of two massive companions around one star in a close binary system—one so-called giant planet and one brown dwarf, or “failed star”—suggests that everything we know about the formation of solar systems might be wrong, say University of Florida astronomy professor Jian Ge and postdoctoral researcher Bo Ma.

The first, called MARVELS-7a, is 12 times the mass of Jupiter, while the second, MARVELS-7b, has 57 times the mass of Jupiter.

Astronomers believe that planets in our solar system formed from a collapsed disk-like gaseous cloud, with our largest planet, Jupiter, buffered from smaller planets by the asteroid belt. In the new binary system, HD 87646, the two giant companions are close to the minimum mass for burning deuterium and hydrogen, meaning that they have accumulated far more dust and gas than what a typical collapsed disk-like gaseous cloud can provide.

They were likely formed through another mechanism. The stability of the system despite such massive bodies in close proximity raises new questions about how protoplanetary disks form.

HD 87646’s primary star is 12 percent more massive than our sun, yet is only 22 astronomical units away from its secondary, a star about 10 percent less massive than our sun, roughly the distance between the sun and Uranus in our solar system.

An astronomical unit is the mean distance between the center of the Earth and our sun, but in cosmic terms, is a relatively short distance. Within such a short distance, two giant companions are orbiting the primary star at about 0.1 and 1.5 astronomical units away.

For such large companion objects to be stable so close together defies our current popular theories on how solar systems form.

The planet-hunting Doppler instrument WM Keck Exoplanet Tracker, or KeckET, is unusual in that it can simultaneously observe dozens of celestial bodies. Ge says this discovery would not have been possible without a measurement capability such as KeckET to search for a large number of stars to discover a very rare system like this one.

The survey of HD 87646 occurred in 2006 during the pilot survey of the Multi-object APO Radial Velocity Exoplanet Large-area Survey (MARVELS) of the SDSS-III program, and Ge led the MARVELS survey from 2008 to 2012.

It has taken eight years of follow-up data collection through collaboration with over 30 astronomers at seven other telescopes around the world and careful data analysis to confirm what Ge calls a “very bizarre” finding.

The team will continue to analyze data from the MARVELS survey; their current findings appear online in the Astronomical Journal.

Source: Republished from Futurity.org as a derivative work under the Attribution 4.0 International license. Original article posted to Futurity by

Now, Check Out:

Here’s Evidence that a Massive Collision Formed the Moon

Scientists have new evidence that our moon formed when a planet-sized object struck the infant Earth some 4.5 billion years ago.

Lab simulations show that a giant impact of the right size would not only send a huge mass of debris hurtling into space to form what would become the moon. It would also leave behind a stratified layer of iron and other elements far below Earth’s surface, just like the layer that seismic imaging shows is actually there.

Johns Hopkins University geoscientist Peter Olson says a giant impact is the most prevalent scientific hypothesis on how the moon came to be, but has been considered unproven because there has been no “smoking gun” evidence.

“We’re saying this stratified layer might be the smoking gun,” says Olson, a research professor in earth and planetary sciences. “Its properties are consistent with it being a vestige of that impact.”

“Our experiments bring additional evidence in favor of the giant impact hypothesis,” says Maylis Landeau, lead author of the paper and a postdoctoral fellow at Johns Hopkins when the simulations were done. “They demonstrate that the giant impact scenario also explains the stratification inferred by seismology at the top of the present-day Earth’s core. This result ties the present-day structure of Earth’s core to its formation.”

1,800 miles below Earth’s crust

The argument compares evidence on the stratified layer—believed to be some 200 miles (322 kilometers) thick and 1,800 miles (2,897 kilometers) below the Earth’s surface—with lab simulations of the turbulence of the impact. The turbulence in particular is believed to account for the stratification—meaning there are materials in layers rather than a homogeneous composition—at the top of the planet’s core.

The stratified layer is believed to contain iron and lighter elements, including oxygen, sulfur, and silicon. The existence of the layer is understood from seismic imaging; it is far too deep to be sampled directly.

Up to now, most simulations of the hypothetical big impact have been done in computer models and have not accounted for impact turbulence, Olson says. Turbulence is difficult to simulate mathematically, he adds.

The researchers simulated the impact using liquids meant to approximate the turbulent mixing of materials that would have occurred when a planetary object struck when Earth was just about fully formed—a “proto-Earth,” as scientists call it.

Olson says the experiments depended on the principle of “dynamic similarity.” In this case, that means scientists can make reliable comparisons of fluid flows without doing an experiment as big and powerful as the original Earth impact, which—of course—is impossible. The study in Olson’s lab was meant to simulate the key ratios of forces acting on each other to produce the turbulence of the impact that could leave behind a layered mixture of material.

The researchers conducted more than 60 trials in which about 3.5 ounces of saline or ethanol solutions representing the planetary projectile that hit the Earth were dropped into a rectangular tank holding about 6 gallons of fluid representing the early Earth. In the tank was a combination of fluids in layers that do not mix: oil floating on the top to represent the Earth’s mantle and water below representing the Earth’s core.

Analysis showed that a mix of materials was left behind in varying amounts and that the distribution of the mixture depended on the size and density of the projectile hitting the Earth. The authors argue for a moon-forming projectile smaller or equal to the size of Mars, a bit more than half the size of Earth.

A summary of the study has been published by the journal Nature Geoscience.

Source: Republished from Futurity.org as a derivative work under the Attribution 4.0 International license. Original article posted to Futurity by .

Featured Image Credit: Brian, via Wikimedia Commons, CC BY-2.0

Now, Check Out:

NASA-Funded Sounding Rocket Solves One Cosmic Mystery, Reveals Another

In the last century, humans realized that space is filled with types of light we can’t see – from infrared signals released by hot stars and galaxies, to the cosmic microwave background that comes from every corner of the universe. Some of this invisible light that fills space takes the form of X-rays, the source of which has been hotly contended over the past few decades.

It wasn’t until the flight of the DXL sounding rocket, short for Diffuse X-ray emission from the Local galaxy, that scientists had concrete answers about the X-rays’ sources. In a new study, published Sept. 23, 2016, in the Astrophysical Journal, DXL’s data confirms some of our ideas about where these X-rays come from, in turn strengthening our understanding of our solar neighborhood’s early history. But it also reveals a new mystery – an entire group of X-rays that don’t come from any known source.

dxl
NASA-funded researchers sent a sounding rocket through the sun’s dense helium wake, called the helium-focusing cone, to understand the origin of certain X-rays in space. (Conceptual graphic not to scale.) Credits: NASA Goddard’s Conceptual Image Lab/Lisa Poje. Click/Tap for larger image

The two known sources of X-ray emission are the solar wind, the sea of solar material that fills the solar system, and the Local Hot Bubble, a theorized area of hot interstellar material that surrounds our solar system.

“We show that the X-ray contribution from the solar wind charge exchange is about forty percent in the galactic plane, and even less elsewhere,” said Massimiliano Galeazzi, an astrophysicist at the University of Miami and an author on the study. “So the rest of the X-rays must come from the Local Hot Bubble, proving that it exists.”

However, DXL also measured some high-energy X-rays that couldn’t possibly come from the solar wind or the Local Hot Bubble.

“At higher energies, these sources contribute less than a quarter of the X-ray emission,” said Youaraj Uprety, lead author on the study and an astrophysicist at University of Miami at the time the research was conducted. “So there’s an unknown source of X-rays in this energy range.”

In the decades since we first discovered the X-ray emission that permeates space, three main theories have been bandied about to explain its origins. First, and quickly ruled out, was the idea that these X-rays are a kind of background noise, coming from the distant reaches of the universe. Our galaxy has lots of neutral gas that would absorb X-rays coming from distant sources – meaning that these X-rays must originate somewhere near our solar system.

The Diffuse X-ray emission from the Local galaxy, or DXL, sounding rocket launched from White Sands Missile Range in New Mexico on Dec. 13, 2012, to study the source of certain X-rays observed near Earth. Credits: White Sands Missile Range, Visual Information Branch
The Diffuse X-ray emission from the Local galaxy, or DXL, sounding rocket launched from White Sands Missile Range in New Mexico on Dec. 13, 2012, to study the source of certain X-rays observed near Earth.
Credits: White Sands Missile Range, Visual Information Branch

So what could produce this kind of X-ray so close to our solar system? Scientists theorized that there was a huge bubble of hot ionized gas enveloping our solar system, with electrons energetic enough that they could release X-rays like this. They called this structure the Local Hot Bubble.

“We think that around 10 million years ago, a supernova exploded and ionized the gas of the Local Hot Bubble,” said Galeazzi. “But one supernova wouldn’t be enough to create such a large cavity and reach these temperatures – so it was probably two or three supernova over time, one inside the other.”

The Local Hot Bubble was the prevailing theory for many years. Then, in the late 1990s, scientists discovered another source of X-rays – a process called solar wind charge exchange.

Our sun is constantly releasing solar material in all directions, a flow of charged particles called the solar wind. Like the sun, the solar wind is made up of ionized gas, where electrons and ions have separated. This means that the solar wind can carry electric and magnetic fields.

When the charged solar wind interacts with pockets of neutral gas, where the electrons and ions are still tightly bound together, it can pick up electrons from these neutral particles, exciting them. As these electrons settle back into a stable state, they lose energy in the form of X-rays – the same type of X-rays that had been thought to come from the Local Hot Bubble.

The discovery of this solar wind X-ray source posed a problem for the Local Hot Bubble theory, since the only indication that it existed were these X-ray observations. But if the hot bubble did exist, it could tell us a lot about how our corner of the galaxy formed.

“Identifying the X-ray contribution of the Local Hot Bubble is important for understanding the structure surrounding our solar system,” said Uprety, who is now an astrophysicist at Middle Tennessee State University. “It helps us build better models of the interstellar material in our solar neighborhood.”

Distinguishing between X-rays from the solar wind and X-rays from the Local Hot Bubble was a challenge – that’s where DXL comes in. DXL flew on what’s called a sounding rocket, which flies for some 15 minutes. These few minutes of observing time above Earth’s atmosphere are valuable, since Earth’s blocks most of these X-rays, making observations like this impossible from the ground. Such short-duration sounding rockets provide a relatively inexpensive way to gather robust space observations.

DXL is the second spacecraft to measure the X-rays in question, but unlike the previous mission – a satellite called ROSAT – DXL flew at a time when Earth was passing through something called the helium-focusing cone. The helium-focusing cone is a region of space where neutral helium is several times denser than in the rest of the inner solar system.

“The solar system is moving through interstellar space at about 15 miles per second,” said Uprety. “This space is filled with hydrogen and helium. The helium is a little heavier, so it carves around the sun to form a tail.”

Because solar wind charge exchange is dependent on having lots of neutral material to interact with, measuring X-rays in the helium-focusing cone could help scientists definitively determine how much of the X-ray emission comes from the solar wind, and how much – if any – comes from the Local Hot Bubble.

DXL’s data revealed that about forty percent of most observed X-rays come from the solar wind. But in higher energy ranges, some X-rays are still unexplained. DXL’s observations show that less than a quarter of the X-ray emission at higher energy levels comes from the solar wind, and the Local Hot Bubble isn’t a good explanation either.

“The temperature of the Local Hot Bubble is not high enough to produce X-rays in this energy range,” said Uprety. “So we’re left with an open question on the source of these X-rays.”

DXL launched from White Sands Missile Range in New Mexico on Dec. 13, 2012. DXL is supported through NASA’s Sounding Rocket Program at the agency’s Wallops Flight Facility at Wallops Island, Virginia, which is managed by NASA’s Goddard Space Flight Center in Greenbelt, Maryland. NASA’sHeliophysics Division manages the sounding-rocket program for the agency.

Source: News release from NASA.gov, used under public domain rights and in accordance with the NASA Media Guidelines

Now, Check Out: